

TDS-C01無料試験問題と解答PDF最新問題2023年12月
最新TDS-C01試験問題集で最近更新された270問題
質問 # 54
True or False: All rows from both tables are returned in an INNER JOIN
- A. True
- B. False
正解:B
解説:
Explanation
The INNER JOIN keyword selects all rows from both tables as long as there is a match between the columns.
Consider 2 tables "Orders" and "Customers".
If there are records in the "Orders" table that do not have matches in "Customers", these orders will not be shown!
質問 # 55
Which of the following sets would you use to compare the members?
- A. Dynamic Sets
- B. Combined Sets
- C. Static Sets
- D. None of these
正解:B
解説:
You can combine two sets to compare the members. When you combine sets you create a new set containing either the combination of all members, just the members that exist in both, or members that exist in one set but not the other.
Combining sets allows you to answer complex questions and compare cohorts of your data. For example, to determine the percentage of customers who purchased both last year and this year, you can combine two sets containing the customers from each year and return only the customers that exist in both sets.
To combine two sets, they must be based on the same dimensions. That is, you can combine a set containing the top customers with another set containing the customers that purchased last year. However, you cannot combine the top customers set with a top products set.


質問 # 56
When using Animations in a Tableau, which of the following is the default duration for animations?
- A. 0.4s
- B. 0.3s
- C. 0.2s
- D. 0.5s
正解:B
解説:
The LATEST Tableau Desktop Sepcialist exam blueprint now requires you to know some basics about animations as well!
NOTE: Animations are DISABLED by default and must be manually enabled.

You can also reset all settings to default by clickin on 'Reset All'
質問 # 57
The calculation [Ship Date] - [Order Date] will return _______________
- A. Number of orders shipped between these dates
- B. Number of days between these dates
- C. Number of orders placed in that duration
- D. Number of unique orders placed between these dates
正解:B
解説:
Explanation
As the names suggest, if we subtract the order date from the shipping date, we simply get the number of days between these 2 dates.
We can these use this calculated field in our charts, and can use COUNT, SUM, AVG etc with them according to our need.
質問 # 58
Which of the following are required to create a trend line?
- A. 2 measures on opposing axes, or a date and a measure on
opposing axes. - B. 2 dimensions, or a date and a dimension on opposing axes.
- C. 1 measure, or a date and a dimension on opposing axes.
- D. 1 measure only
正解:A
解説:
To create a trend line, we need:
質問 # 59
According to Tableau's 'Order of Operations', which of the following filters is applied FIRST?
- A. Context Filter
- B. Dimension Filter
- C. Measure Filter
- D. Extract Filter
正解:D
解説:
Explanation
According to Tableau's order of operations, the Extract filter is right at the top of the hierarchy. The data filtered in the Extract is then passed on to what we see in the Data Pane. See below: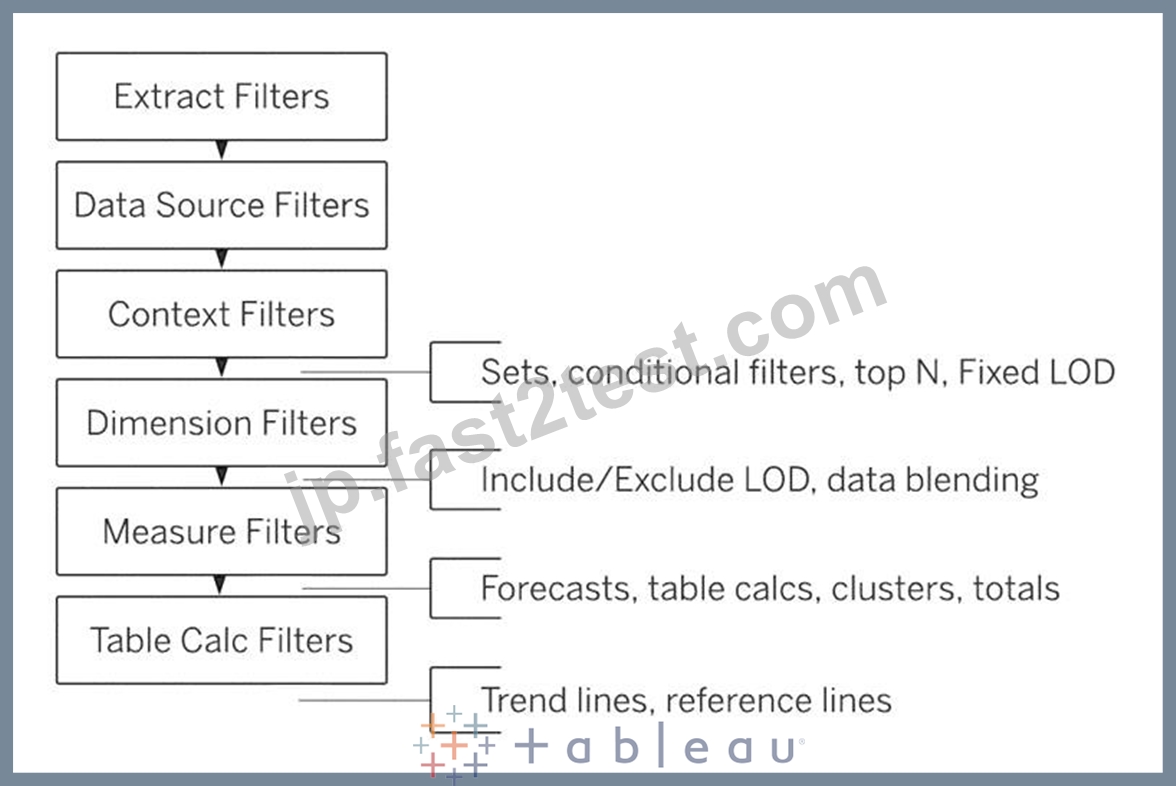
質問 # 60
Which of the following is a compelling reason to export a sheet in Tableau to a PDF?
- A. If we want to use filters in the visualisation.
- B. If we want to dynamically enter parameters to the visualisation.
- C. If we want to interact with the visualisation.
- D. If we want a static view of the visualisation.
正解:D
解説:
Explanation
Exporting the visualisation gives us a static view of the visualisation.
It is NOT possible to interact with it, use filters, or dynamically enter anything in a visualisation exported PDF.
In Tableau Desktop, you can save views as PDF files rather than printing them as hard copies. You do not need to have Adobe Acrobat installed on your computer.
When you print an individual sheet to PDF, filters in the view are not included. To show filters, create a dashboard containing the sheet and export the dashboard to PDF. (IMPORTANT)
質問 # 61
Which of the following is a good reason for using a bullet graph?
- A. Forecasting future sales
- B. Displaying the year-on-year growth in sales
- C. Comparing the actual sales against the target sales
- D. Analysing the trend over a given time period
正解:C
解説:
A bullet graph is a variation of a bar graph developed to replace dashboard gauges and meters. A bullet graph is useful for comparing the performance of a primary measure to one or more other measures. Below is a single bullet graph showing how actual sales compared to estimated sales.
質問 # 62
What term is used to describe the following picture?
- A. Larger image
- B. Parameter
- C. Group
- D. Set
- E. Hierarchy
正解:D
解説:
When you connect to a data source, Tableau automatically separates date fields into hierarchies so you can easily break down the viz. You can also create your own custom hierarchies. For example, if you have a set of fields named Region, State, and County, you can create a hierarchy from these fields so that you can quickly drill down between levels in the viz.
質問 # 63
_____________ contains the visualisations, info needed to build the visualisations, and a copy of the data source.
- A. Tableau Workbook (.twb)
- B. Tableau Bookmark (.tbm)
- C. Tableau Packaged Workbook (.twbx)
- D. Tableau Data Extract (.tde)
正解:C
解説:
TWBX is all in one. It contains viz, info needed to build the viz, and a copy of the data source. It doesn't contain extracts of the data but can contain both live and data extracts. Best if want to eliminate the barrier of data access.
Create a .twbx with file-based data sources
1) Select File > Save As.
2) Specify a file name for the packaged workbook in the Save As dialog box.
3)Select Tableau Packaged Workbooks on the Save as type drop-down list.
4) Click Save.
5) The default location is the Workbooks folder of the Tableau repository. However, you can save packaged workbooks to any directory you choose.
The following files are included in packaged workbooks:
--> Background images
--> Custom geocoding
--> Custom shapes
--> Local cube files
--> Microsoft Access files
--> Microsoft Excel files
--> Tableau extract files (.hyper or .tde)
--> Text files (.csv, .txt, etc.)
質問 # 64
Using the dataset, create a bar chart showing the average Quantity broken down by Region, and filtered by Country to only show Japan. What was the average Quantity in the State of Tokyo?
- A. 3.704
- B. 3.840
- C. 3.000
- D. 3.500
正解:A
質問 # 65
True or False: LEFT JOIN returns all rows from the left table, with the matching rows in the right table
- A. False
- B. True
正解:B
解説:
Explanation
This is true, indeed!
The LEFT JOIN keyword returns all records from the left table (table1), and the matched records from the right table (table2). The result is NULL from the right side, if there is no match.
質問 # 66
Which of the following are valid Dashboard size options?
- A. Scaled
- B. Automatic
- C. Range
- D. Fixed Size
正解:B、C、D
解説:
Scaled is NOT a valid size options when creating Dashboards in Tableau!
After you create a dashboard, you might need to resize and reorganize it to work better for your users.

質問 # 67
Relationships are represented by __________________ and operate at the ____________________.
- A. Venn diagrams, logical layer
- B. noodles, logical layer
- C. noodles, physical layer
- D. Venn diagrams, physical layer
正解:B
解説:
From the official documentation:
The default view that you first see in the Data Source page canvas is the logical layer of the data source. You combine data in the logical layer using relationships (or noodles).
質問 # 68
What is created by a calculated field that has a formula of SUM(Sales)/SUM(Profit)?
- A. A set
- B. A parameter
- C. A dimension
- D. A measure
正解:D
解説:
a calculated field that has a formula of SUM(Sales)/SUM(Profit) is a measure, because it returns a numeric value that can be aggregated and used for analysis. A parameter is a user-defined variable that can be used in calculations or filters. A dimension is a categorical field that can be used to group or slice data. A set is a subset of data based on some condition.
質問 # 69
Broadly speaking, after an importing a dataset in Tableau Desktop, all fields in it are broken down into _______________________
- A. Dimensions and Measures
- B. Numbers and Headers
- C. Rows and Columns
- D. Labels and Values
正解:A
解説:
When you connect to a new data source, Tableau assigns each field in the data source as dimension or measure in the Data pane, depending on the type of data the field contains. You use these fields to build views of your data.
Further,
質問 # 70
By default, what does Tableau do when you connect to a data source?
- A. Sorts the data in descending order
- B. Loads your actual file into Tableau
- C. Creates a live connection to the data
- D. Creates an extract of the data
正解:C
解説:
Before you can build a view and analyze your data, you must first connect Tableau to your data. Tableau supports connecting to a wide variety of data, stored in a variety of places.
By default, when you connect a data source to Tableau, Tableau will create a live connection to the data.
Live connection refers to a data source that contains direct connection to underlying data, which provides real-time or near real-time data. With a live connection, Tableau makes queries directly against the database or other source, and returns the results of the query for use in a workbook. Users can create live connections and then share them on Tableau Server so that other Tableau users can use the same data using the same connection and filtering settings.
質問 # 71
Which Sub-Category had the least Profit in the Office Supplies category?
- A. Envelopes
- B. Labels
- C. Binders
- D. Fasteners
正解:D
解説:
To reach the correct answer, follow the steps below:
1) Drag Category, and sub-category to the row shelf. Drag Profit to the Column shelf
2) Click the Sort-ascending icon as shown above, to sort the profits from least to greatest as shown:
Click the 'Show mark labels icon'
As we can see, Fasteners has the least Profit in the Office Supplies Category, and hence is our correct answer!
質問 # 72
......
Tableau TDS-C01リアル2023年最新のブレーン問題集で模擬試験問題集:https://jp.fast2test.com/TDS-C01-premium-file.html
TDS-C01試験問題リアルTDS-C01練習問題集:https://drive.google.com/open?id=1EZEKGuVrzRmNL5nxXJ1rS_iizgJkTwYK