

Tableau TDA-C01日常練習試験は2024年最新のに更新された122問あります
有効問題を試そう!TDA-C01試験で実際の試験問題と解答
質問 # 49
You are developing a data source in Tableau Prep.
You have two tables named Orders and Employees.
The Orders table was created in 2019 and contains the following columns.
The Employees table contains all the employee information for the various sales teams in the sales department and contains the following columns
You want to prepare the data so that you can analyze sales trends over time for every sales team.
Which three actions should you perform in order? (Place the three correct options in order. Use the arrows to move Options to Answer Area. Use Answer Area arrows to re-order the options.)
正解:
解説:
Explanation:
There are different ways to prepare the data in Tableau Prep, but one possible answer is:
Answer area:
Join the tables.
Aggregate the data by Sales Team.
Add the following filter to the Employees table: Sale Team - Team Alpha.
To analyze sales trends over time for every sales team, you need to combine the data from the Orders and Employees tables. You can do this by joining the tables on the Rep ID column, which is a common identifier for both tables. This will create a single table with all the columns from both tables. Next, you need to aggregate the data by Sales Team, which is the level of analysis you want. You can do this by grouping the data by the Sales Team column and applying an aggregation function (such as sum, average, count, etc.) to the other columns that you want to measure (such as Total Amount, Rep Tenure, etc.). This will create a summary table with one row for each sales team and the aggregated values for the other columns. Finally, you need to filter the data to focus on a specific sales team, such as Team Alpha. You can do this by adding a filter to the Employees table and selecting only the rows where Sales Team equals Team Alpha. This will remove the rows for other sales teams and keep only the data for Team Alpha.
References:
[Tableau Certified Data Analyst Exam Prep Guide], page 9, section "Preparing Data"
[Tableau Help: Join Your Data]
[Tableau Help: Aggregate Your Data]
[Tableau Help: Filter Your Data]
質問 # 50
You have a dataset that contains sates dat
a. The following is a sample of the data.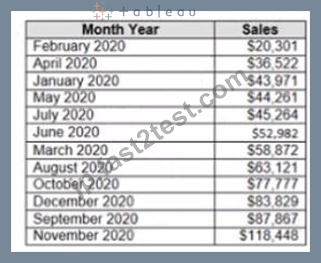
You need to return a value of true if a month has sales greater than $50 000. otherwise the formula must return a value of false.
Which two formulas achieve the goal Choose two
- A. [Sales] > 50000
- B. SUM{[Sales]) IN (50000)
- C. IIF(SUM< [Sales] )>50000, TRUE, FALSE)
- D. MAX< [Sales], 50000)
正解:A、C
解説:
B) IIF(SUM([Sales]) > 50000, TRUE, FALSE)
D) [Sales] > 50000
The IIF function is a logical function that returns one value if a condition is true, and another value if the condition is false. In this case, the condition is SUM([Sales]) > 50000, which means that the sum of sales for a month is greater than $50,000. The function will return TRUE if the condition is true, and FALSE if the condition is false.
The comparison operator > is a logical operator that returns TRUE if the left operand is greater than the right operand, and FALSE otherwise. In this case, the operands are [Sales] and 50000, which means that the sales for a month are greater than $50,000. The operator will return TRUE if the sales are greater than $50,000, and FALSE otherwise.
The other options are not correct for this scenario. The IN function is a logical function that returns TRUE if a value is in a set of values, and FALSE otherwise. In this case, the value is SUM([Sales]), which is not in the set of values (50000). The function will always return FALSE. The MAX function is an aggregation function that returns the maximum value in a field or expression. In this case, the field or expression is [Sales], 50000, which is not valid syntax. The function will return an error. Reference: https://help.tableau.com/current/pro/desktop/en-us/functions_functions_logical.htm#IIF https://help.tableau.com/current/pro/desktop/en-us/operators.htm https://help.tableau.com/current/pro/desktop/en-us/functions_functions_aggregate.htm#MAX Explanation:
The two formulas that will return a value of true if a month has sales greater than $50,000, otherwise the formula must return a value of false, are:
質問 # 51
Open the link to Book1 found on the desktop. Open Disciplines worksheet.
Filter the table to show the Top 10 NOC based on the number of medals won.
正解:
解説:
Send us your feedback on it
質問 # 52
You create a worksheet named Sales by Region and hide the tide of the worksheet. You print the worksheet as a PDF and notice that the worksheet title appears. You need to prevent the title from appearing when you print the worksheet as a PDF. Which settings should configure from the File menu in Tableau Desktop?
- A. Export As PowerPoint
- B. Export As Version
- C. Print
- D. Share
- E. Page Setup
正解:E
質問 # 53
From Tableau Desktop you sign in lo a Tableau Server site.
What appears in the list of available data sources when you search for a published data source?
- A. All the data sources published to the site
- B. All the data sources published to the Tableau Server within the folders to which you have access
- C. All the data sources published to the Tableau Server
- D. All the data sources published to the site within the folders to which you have access
正解:D
解説:
When you sign in to a Tableau Server site from Tableau Desktop and search for a published data source, you will see all the data sources published to the site within the folders to which you have access. You will not see data sources published to other sites or folders that you do not have permission to view. You can also filter your search by project, owner, or tag. Reference: https://help.tableau.com/current/pro/desktop/en-us/connect_basic.htm https://help.tableau.com/current/pro/desktop/en-us/connect_tableauserver.htm
質問 # 54
You create the following worksheet
The Pick Measure parameter contains the following list of values
Users can select a value from Pick Measure to change the visualization to show either the Sales measure or the Profit measure.
Which formula is used in the Selected Measure calculated field lo switch between measures?
- A. Case [Pick Measure]
WHEN 1 then ([Sales])
WHEN 2 then ([Profit]) END - B. Case [Pick Measure:
WHEN [Sales] then 1
WHEN [Profit] then 2 END - C. Case STFMEPick Measure])
WHEN "Sales" then ([Sales])
WHEN "Profit" then ([Profit]) e::i - D. Case AVG([Pick Measure])
WHEN [Sales] then 1
WHEN [Profit] then 2
END
正解:A
解説:
https://help.tableau.com/current/pro/desktop/en-us/parameters_swap.htm
質問 # 55
You have a database that includes field named sales, City and Region.
You have the following chart that shows the number of sales made in different cities.
You want to dynamically show the corresponding region when users hover their mouse over any of the bars.
What should you do?
- A. Drag Region to Tooltip on the Marks card
- B. Right-click a bar in the chart select Mark Label and then select Always show.
- C. Right-click a in the chat, select Annotate and then select Mark.
- D. Edit the aliases for City.
正解:C
質問 # 56
You create the following worksheet
The Pick Measure parameter contains the following list of values
Users can select a value from Pick Measure to change the visualization to show either the Sales measure or the Profit measure.
Which formula is used in the Selected Measure calculated field lo switch between measures?
- A. Case [Pick Measure:
WHEN [Sales] then 1
WHEN [Profit] then 2 END - B. Case AVG([Pick Measure])
WHEN [Sales] then 1
WHEN [Profit] then 2
END - C. Case [Pick Measure]
WHEN 1 then ([Sales])
WHEN 2 then ([Profit]) END - D. Case STFMEPick Measure])
WHEN "Sales" then ([Sales])
WHEN "Profit" then ([Profit]) e::i
正解:D
解説:
https://help.tableau.com/current/pro/desktop/en-us/parameters_swap.htm
質問 # 57
Open the link to Book1 found on the desktop. Open Disciplines worksheet.
Filter the table to show the Top 10 NOC based on the number of medals won.
- A. Send us your
- B. Send us your feedback on it.
正解:B
質問 # 58
You have a table that contains four columns named Order Date, Country, Sales, and Profit.
You need to add a column that shows the day of the week for each row. For example, orders placed on August
31, 2022, will show a day of
Wednesday.
How should you complete the formula? (Use the dropdowns in the Answer Area to select the correct options to complete the formula.)
正解:
解説:
Explanation:
To add a column that shows the day of the week for each row, you should complete the formula as follows:
DATENAME
(
'weekday'
, [Order Date])
The DATENAME function in Tableau returns the name of a specified part of a date or datetime value, such as the year, month, or day. It takes two arguments: the date part and the date. In this question, you want to return the name of the weekday, such as Monday, Tuesday, or Wednesday, for each order date. Therefore, you need to use 'weekday' as the date part and [Order Date] as the date. The formula will return a string value that represents the name of the weekday for each order date.
References:
Tableau Help: DATENAME Function
Tableau Help: Date Functions
To add a column that shows the day of the week for each row, you should complete the formula as follows:
DATENAME
(
'weekday'
, [Order Date])
The DATENAME function in Tableau returns the name of a specified part of a date or datetime value, such as the year, month, or day. It takes two arguments: the date part and the date. In this question, you want to return the name of the weekday, such as Monday, Tuesday, or Wednesday, for each order date. Therefore, you need to use 'weekday' as the date part and [Order Date] as the date. The formula will return a string value that represents the name of the weekday for each order date.
References:
Tableau Help: DATENAME Function
Tableau Help: Date Functions
質問 # 59
Open the link to Book1 found on the desktop. Use the Superstore data source.
Split the Customer Name field into two fields named First Name and Last Name.
正解:
解説:
check the steps below in explanation.
Explanation:
To split the Customer Name field into two fields named First Name and Last Name, you need to do the following steps:
Open the link to Book1 found on the desktop. This will open the Tableau workbook that uses the Superstore data source.
Go to the Data Source tab at the bottom of the workbook to see the data source page. You will see a table that shows the fields and values from the Superstore data source.
Right-click on Customer Name in the table and select Split from the menu. This will split the field into two fields based on a separator, which is a space by default. You will see two new fields named Customer Name - Split 1 and Customer Name - Split 2 in the table.
Right-click on Customer Name - Split 1 and select Rename from the menu. Type First Name as the new name and press Enter. This will rename the field as First Name.
Right-click on Customer Name - Split 2 and select Rename from the menu. Type Last Name as the new name and press Enter. This will rename the field as Last Name.
References: https://help.tableau.com/current/pro/desktop/en-us/datasource_prepare.htm
https://help.tableau.com/current/pro/desktop/en-us/split.htm
https://help.tableau.com/current/pro/desktop/en-us/renamefield.htm
質問 # 60
You have the following line chart that shows the average sales by month.
Which month had the biggest increase in swage sales compared to me previous month in 2019?
- A. October
- B. August
- C. November
- D. December
正解:C
質問 # 61
Open the link to Book1 found on the desktop. Open the Histogram worksheet and use the Superstone data source.
Create a histogram on the Quantity field by using bin size of 3.
正解:
解説:
Send us your feedback on it
質問 # 62
You have a data source that has two tables named Table1 and Table2. Table1 is the primary table and Table2 is the secondary table.
You want to combine the tables by using Tableau Prep. The combined table must include only values from Table1 that do NOT match any values in Table2. The field values from Table2 must appear as null values.
Which type of join should you use?
- A. Union
- B. Inner
- C. Left
- D. Left only
- E. Full outer
正解:D
解説:
To combine the tables by using Tableau Prep and include only values from Table1 that do not match any values in Table2, you should use a left only join. A left only join is a type of join that returns only the rows from the primary table (Table1) that have no matching rows in the secondary table (Table2). The field values from Table2 will appear as null values in the combined table. A left only join is also known as an anti-join or an exclusion join. Reference:
Tableau Certified Data Analyst Exam Prep Guide, page 9, section "Preparing Data" Tableau Help: Join Your Data Tableau Help: Left Only Join
質問 # 63
You have the following dashboard.
From the context menu of Sales over time, select Ignore Actions.
Several Lays later, you decide that you want to filter both Sales over time and Detail table by selecting a data point on the map.
What should you do?
- A. From the context menu of Profits by state, deselect Use as Filter and then select Use as Filter.
- B. From the context menu of Sales over lime, select Filters and then select Enable Auto Update.
- C. From the context menu of Sales over time, select Use as Filter and then deselect Use as Filter
- D. From the context menu of Detail table, select Ignore Actions.
正解:A
質問 # 64
......
テストエンジンに練習TDA-C01テスト問題:https://jp.fast2test.com/TDA-C01-premium-file.html
TDA-C01リアル試験問題でテストエンジン問題集トレーニングには122問あります:https://drive.google.com/open?id=17hh7ZSH0g7ZeatO2QP7O403yh-Buq4lc