

無料TDA-C01試験ブレーン問題集認定ガイド問題と解答
TDA-C01認定概要最新のTDA-C01PDF問題集
Tableau TDA-C01試験は、Tableauを使用したデータ分析と可視化のスキルを検証するグローバルに認められた認定資格です。この認定資格により、個人はその分野での専門知識を示し、同僚から目立つ機会を提供されます。また、多くの組織がデータ分析と可視化のニーズを担当するためにTableau認定の専門家を必要とするため、個人に競争優位性を提供します。
質問 # 68
You have a data source that has two tables named Table1 and Table2. Table1 is the primary table and Table2 is the secondary table.
You want to combine the tables by using Tableau Prep. The combined table must include only values from Table1 that do NOT match any values in Table2. The field values from Table2 must appear as null values.
Which type of join should you use?
- A. Union
- B. Inner
- C. Full outer
- D. Left only
- E. Left
正解:D
解説:
To combine the tables by using Tableau Prep and include only values from Table1 that do not match any values in Table2, you should use a left only join. A left only join is a type of join that returns only the rows from the primary table (Table1) that have no matching rows in the secondary table (Table2). The field values from Table2 will appear as null values in the combined table. A left only join is also known as an anti-join or an exclusion join. Reference:
Tableau Certified Data Analyst Exam Prep Guide, page 9, section "Preparing Data" Tableau Help: Join Your Data Tableau Help: Left Only Join
質問 # 69
You have the following dataset.
Which Level of Detail (LOD) expression should you use to calculate tie grand total of all the regions?
- A. {FIXED: SUM Sales}
- B. {FIXED: TOTAL (Sales)}
- C. {FIXED: [Region] SUM Sales}
- D. {Fixed: [Region]: TOTAL Sales}
正解:A
解説:
The correct Level of Detail (LOD) expression to calculate the grand total of sales across all regions would be {SUM(Sales)}. The FIXED expression is not needed here because we are not computing the sum at the level of each region, but rather the total sum across all regions. The FIXED keyword is typically used to aggregate at a certain level regardless of the view.
https://help.tableau.com/current/pro/desktop/en-us/functions_functions_tablecalculation.htm#TOTAL
質問 # 70
You have the following dashboard.
When a user selects a only on the map the data on the bar chart must show only the data for the selected city. The data in the bar chart must change only when the user selects a different city How should you configure the dashboard action? (Use the dropdowns in the Answers Area to select the correct options.)
正解:
解説:
質問 # 71
You company has two divisions located in the United States and Germany Bach division has a separate database. The following is a sample of the sales data for the division in the United States.
The following is a sample of the sales data for me division in Germany.
You have population data in a file named Populatio.csv. the following is a sample of the data.
You plan to create a visualization that ml show tie sales per capita for each salesperson Each salesperson must be identified by identified by their full name.
You need to prepare the data to support the planned visualization. The data source must support being published .
Which four actions should you perform in order?
(Place the four correct options n order Use the arrows to move Options to Answer Area arrows to re-order the options.
Use Answer Area arrows to re-order the options)
正解:
解説:
1 - Open Tableau Desktop
2 - Create a new column to concatenate the name for the Germany division.
3 - Union the sales data of both divisions.
4 - Join the sales data and the population data by using City as the join field
質問 # 72
You need to change the values of a dimension without creating a new field.
What should you do?
- A. Transforms the fields
- B. Rename the fields
- C. Create groups
- D. Create aliases
正解:D
解説:
You can create aliases for the members of a dimension by right-clicking the dimension in the Data pane or in the view and selecting Aliases. This changes how the values are displayed in the view, but not the underlying data. For example, you can create an alias for "Central" as "Midwest".
質問 # 73
You have a dataset that has four fields named Category. Profit Sates and Customer Name. You need to create the following visualization.

正解:
解説:
質問 # 74
You have the following two datasets:
* A Microsoft Excel worksheet that has two columns named Employee Name and Department
* A Microsoft SQL Server table that has three columns named Employee Name. Pay Grade and Team Size.
You want to use Tableau Prep to join the two datasets.
Which three actions should you perform in order? (Place the three correct options in order.)
正解:
解説:
1 - From the connections pane, connect to both data sources
2 - Join both datasets and select the join type
3 - Specify Employee Name as the join key
Reference:
https://help.tableau.com/current/prep/en-us/prep_connect.htm https://help.tableau.com/current/prep/en-us/prep_join.htm https://help.tableau.com/current/prep/en-us/prep_join_types.htm
質問 # 75
Open the link to Book1 found on the desktop. Open the Line worksheet.
Modify the chart to show only main and max values of both measures in each region.
正解:
解説:
check the steps below in explanation
Explanation:
To modify the chart to show only min and max values of both measures in each region, you need to do the following steps:
Open the link to Book1 found on the desktop. This will open the Tableau workbook that contains the Line worksheet.
Click on the Line tab at the bottom of the workbook to open the worksheet. You will see a line chart that shows the sales and profit for each month by region.
Drag Month from the Columns shelf to Filters shelf. This will open a dialog box that allows you to filter by different criteria.
Select Range of Dates from the dialog box. This will show you options to filter by a range of dates or values.
Select Minimum and Maximum from the drop-down list next to Month. This will filter by the minimum and maximum values of Month for each region. You can also enter specific values or use the sliders to adjust the range.
Click OK to apply the filter. You will see that the line chart now shows only min and max values of both measures in each region.
質問 # 76
You have the Mowing dashboard.
Which two elements are floating? Choose two.
- A. The little
- B. The color legend
- C. The map
- D. The Rate of Obesity chart
- E. The state filter
正解:B、E
解説:
To identify which elements are floating on a dashboard, you can look for a gray border around them when you select them. Alternatively, you can open the Layout pane and see which elements have a pin icon next to them. The pin icon indicates that the element is floating and can be moved freely on the dashboard. Based on these criteria, the state filter and the color legend are floating elements on the dashboard. Reference: https://help.tableau.com/current/pro/desktop/en-us/dashboards_organize_floating_layoutcontainers.htm https://help.tableau.com/current/pro/desktop/en-us/dashboards_create_layouts.htm
質問 # 77
You have a dashboard that is configured for desktop browsers.
You want to customize a layout for mobile users.
Which option should you select first? (Click the appropriate Option in the Answer Area.)
正解:
解説:
質問 # 78
You are subscribed to several views.
You need to unsubscribe from the views.
What should you use?
- A. The Notifications area of Tableau Prep
- B. The Shared with Me page
- C. The My Content area of Tableau web pages
- D. The Data Source page of Tableau Desktop
正解:C
解説:
To unsubscribe from the views, you should use the My Content area of Tableau web pages. This area allows you to manage your subscriptions, as well as your workbooks, views, and data sources. You can select the views you want to unsubscribe from, click Actions, and then click Unsubscribe. You can also change the subscription options, such as the schedule, the format, or the message. References:
Create a Subscription to a View or Workbook - Tableau
Tableau Certified Data Analyst Study Guide
質問 # 79
You create the following worksheet
The Pick Measure parameter contains the following list of values
Users can select a value from Pick Measure to change the visualization to show either the Sales measure or the Profit measure.
Which formula is used in the Selected Measure calculated field lo switch between measures?
- A. Case STFMEPick Measure])
WHEN "Sales" then ([Sales])
WHEN "Profit" then ([Profit]) e::i - B. Case [Pick Measure:
WHEN [Sales] then 1
WHEN [Profit] then 2 END - C. Case [Pick Measure]
WHEN 1 then ([Sales])
WHEN 2 then ([Profit]) END - D. Case AVG([Pick Measure])
WHEN [Sales] then 1
WHEN [Profit] then 2
END
正解:A
解説:
https://help.tableau.com/current/pro/desktop/en-us/parameters_swap.htm
質問 # 80
You have the following dashboard.
Currently the map is used as a filter that affects the data on the otter sheets of the dashboard You need to configure the dashboard to ensure that selecting a data point on the map only tillers the Detail table What should you do?
- A. From the context menu of Profits by Stale deselect Use as Filter
- B. From the context menu of Sales over lime select Remove Dashboard Item
- C. From the context menu of Sales over time select Ignore Actions
- D. From the context menu of Sales over time select Deselect
正解:C
解説:
To configure the dashboard to ensure that selecting a data point on the map only filters the Detail table, you should select Ignore Actions from the context menu of Sales over time. Ignore Actions is a feature that allows you to exclude a sheet from being affected by any actions on the dashboard, such as filters or highlights. You can select Ignore Actions by right-clicking on a sheet on the dashboard and selecting Ignore Actions from the menu.
In this case, you want to exclude Sales over time from being filtered by the map, so you should select Ignore Actions from its context menu. This will make Sales over time ignore any selections on the map and show all values. The Detail table will still be filtered by the map as usual.
The other options are not correct for this scenario. Removing Dashboard Item will delete Sales over time from the dashboard, which is not what you want. Deselecting Use as Filter will disable the map as a filter for any sheet on the dashboard, which is not what you want. Selecting Deselect will clear any selections on the map, but it will not prevent Sales over time from being filtered by future selections. References:
https://help.tableau.com/current/pro/desktop/en-us/actions.htm
https://help.tableau.com/current/pro/desktop/en-us/actions_ignore.htm
On a Tableau dashboard, when a map is used as a filter, it affects all other sheets in the dashboard by default.
To restrict the filter action to only affect the Detail table and not the 'Sales over time' chart, you would modify the action settings. By selecting "Ignore Actions" from the context menu of the 'Sales over time' chart, it will no longer respond to the filtering action initiated by selecting data points on the map.
質問 # 81
You have the following tiled dashboard that has one sheet.
You want to replace fit sheet with Sheet2.
What should you do?
- A. Drag Sheet2 to the dashboard.
- B. Right-click Sheet2 and select Add to Dashboard.
- C. From the context menu of Sheet3. select Deselect
- D. From the context menu of Sheet3. select Remove Dashboard item
- E. Select Sheets and click the Swap Sheet button next to Sheet2.
正解:A
解説:
To replace a sheet on a tiled dashboard, you can simply drag the new sheet from the Sheets pane to the dashboard and drop it over the existing sheet. This will replace the old sheet with the new one and keep the same size and position. Alternatively, you can right-click on the old sheet and select Replace Data Source, then choose the new sheet from the list. Reference: https://help.tableau.com/current/pro/desktop/en-us/dashboards_organize_floating_layoutcontainers.htm https://help.tableau.com/current/pro/desktop/en-us/dashboards_replace_datasource.htm
質問 # 82
You have a dataset that contains sates dat
a. The following is a sample of the data.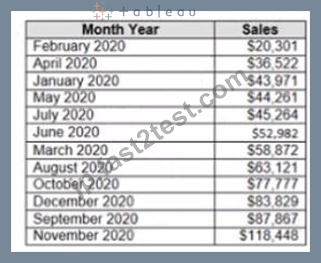
You need to return a value of true if a month has sales greater than $50 000. otherwise the formula must return a value of false.
Which two formulas achieve the goal Choose two
- A. MAX< [Sales], 50000)
- B. [Sales] > 50000
- C. IIF(SUM< [Sales] )>50000, TRUE, FALSE)
- D. SUM{[Sales]) IN (50000)
正解:B、C
解説:
B) IIF(SUM([Sales]) > 50000, TRUE, FALSE)
D) [Sales] > 50000
The IIF function is a logical function that returns one value if a condition is true, and another value if the condition is false. In this case, the condition is SUM([Sales]) > 50000, which means that the sum of sales for a month is greater than $50,000. The function will return TRUE if the condition is true, and FALSE if the condition is false.
The comparison operator > is a logical operator that returns TRUE if the left operand is greater than the right operand, and FALSE otherwise. In this case, the operands are [Sales] and 50000, which means that the sales for a month are greater than $50,000. The operator will return TRUE if the sales are greater than $50,000, and FALSE otherwise.
The other options are not correct for this scenario. The IN function is a logical function that returns TRUE if a value is in a set of values, and FALSE otherwise. In this case, the value is SUM([Sales]), which is not in the set of values (50000). The function will always return FALSE. The MAX function is an aggregation function that returns the maximum value in a field or expression. In this case, the field or expression is [Sales], 50000, which is not valid syntax. The function will return an error. Reference: https://help.tableau.com/current/pro/desktop/en-us/functions_functions_logical.htm#IIF https://help.tableau.com/current/pro/desktop/en-us/operators.htm https://help.tableau.com/current/pro/desktop/en-us/functions_functions_aggregate.htm#MAX Explanation:
The two formulas that will return a value of true if a month has sales greater than $50,000, otherwise the formula must return a value of false, are:
質問 # 83
You subscribe to a view that delivers a daily email to your inbox.
You want to make the subscription available to other stakeholders.
What should you do?
- A. From the worksheet, modify the subscription.
- B. From the My Content overview page, modify the alert.
- C. From the dashboard overview page, modify the subscription.
- D. From the My Content overview page, modify the subscription.
正解:D
質問 # 84
......
ベストなTableau TDA-C01学習ガイドと問題集には2025:https://jp.fast2test.com/TDA-C01-premium-file.html
トップクラスTableau TDA-C01試験材料で学習ガイド!練習問題バージョンで挑もう:https://drive.google.com/open?id=17hh7ZSH0g7ZeatO2QP7O403yh-Buq4lc