

2024年05月 Tableau TDA-C01認定リアル2024年最新の模擬試験合格させます
TDA-C01試験問題と有効なTDA-C01問題集でPDF
Tableau TDA-C01認定は、Tableauを使用したデータ分析と視覚化の専門知識のベンチマークとして広く認識されており、さまざまな業界の雇用主によって高く評価されています。この認定は、データアナリストが仲間と差別化し、Tableauを使用して複雑なデータセットを視覚化および分析する習熟度を実証するのに役立ちます。また、自分の専門的なスキルと知識を検証および強化し、データ分析の最新のトレンドとベストプラクティスを最新の状態に保つ優れた方法です。
質問 # 35
Open the link to Book1 found on the desktop. Open the Movie Durations worksheet.
Replace the existing data source with the Netflix_2019 data source.
正解:
解説:
check the steps below in explanation.
Explanation:
To replace the existing data source with the Netflix_2019 data source, you need to do the following steps:
Open the link to Book1 found on the desktop. This will open the Tableau workbook that contains the Movie Durations worksheet.
Click on the Movie Durations tab at the bottom of the workbook to open the worksheet. You will see a bar chart that shows the number of movies by duration for the existing data source.
Go to the Data Source tab at the bottom of the workbook to see the data source page. You will see a table that shows the fields and values from the existing data source.
Click on the drop-down arrow next to the data source name at the top of the page and select Replace Data Source from the menu. This will open a dialog box that allows you to replace your data source with another one.
Select Netflix_2019 from the list of available data sources and click OK. This will replace your existing data source with the Netflix_2019 data source and update your worksheet accordingly. You may need to fix any broken fields or calculations that result from the replacement.
References: https://help.tableau.com/current/pro/desktop/en-us/datasource_replace.htm
https://help.tableau.com/current/pro/desktop/en-us/datasource_replace_workbook.htm
質問 # 36
You have a data source that contains data tor every city in the Unites States. The following is a sample of the data.
You need to use the City dimension to create a dynamic filter that snows the cities that have a population greater than one million Which type of filter should you use?
- A. Wildcard filter
- B. Top filter
- C. Condition filter
- D. General filter
正解:C
解説:
To use the City dimension to create a dynamic filter that shows the cities that have a population greater than one million, you should use a condition filter. A condition filter is a type of filter that shows only the values that meet a specified condition based on a measure or a calculation. You can create a condition filter by dragging a dimension to the Filters shelf and selecting Condition from the dialog box. Then you can enter a formula or choose an option that defines your condition.
In this case, you want to create a condition filter based on Population, which is a measure. You can drag City to the Filters shelf and select Condition from the dialog box. Then you can choose By field from the tab and select Population > Sum > Greater than > 1000000 from the drop-down lists. This will create a condition filter that shows only the cities that have a sum of population greater than one million.
The other options are not correct for this scenario. A general filter is not a specific type of filter, but a term that refers to any type of filter in Tableau. A wildcard filter is a type of filter that shows only the values that match a specified pattern or string, such as "New*" or "*ton". A top filter is a type of filter that shows only the top or bottom N values of a measure or dimension based on a ranking or an aggregation. Reference: https://help.tableau.com/current/pro/desktop/en-us/filtering.htm https://help.tableau.com/current/pro/desktop/en-us/filtering_condition.htm https://help.tableau.com/current/pro/desktop/en-us/filtering_wildcard.htm https://help.tableau.com/current/pro/desktop/en-us/filtering_topn.htm
質問 # 37
You want to create the following dashboard.
The dashboard will contain two sheets that will connect to the same data source. The top sheet will be configured to filter the bottom sheet.
When you click a category on the top sheet, the sheets must resize as shown in the following exhibit.
How should you lay out the objects on the dashboard?
- A. Add both sheets to the dashboard. Set Fit to Fix width.
- B. Drag a horizontal container to the dashboard and add both sheets to the container. Set the Fit to Standard.
- C. Drag a vertical container to the dashboard and add both sheets to the container. Set Fit to Entire view.
- D. Drag a blank object to the dashboard and add both sheets to the dashboard. Set Fit to Entire view.
正解:C
解説:
To create the dashboard as shown in the image, you need to use a vertical layout container that will adjust the height of the sheets according to the window size. You also need to set the Fit to Entire view option for both sheets so that they will resize proportionally when you click a category on the top sheet. This way, you can achieve the desired effect of having the bottom sheet expand to fill the space left by the top sheet when it filters out some categories. References:
Size and Lay Out Your Dashboard - Tableau
Create a Dashboard - Tableau
Format Dashboard Layout in Tableau - GeeksforGeeks
質問 # 38
You conned to a Microsoft SQL Server database
You need to create a custom SQL query that retrieves rows from a table named Students Only students m the city of Berlin must be returned How should you complete the query? (Drag the appropriate Options to the Answer Area and drop into the correct locations.)
正解:
解説: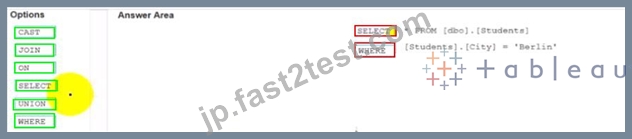
質問 # 39
You have a dataset that has four fields named Category. Profit Sates and Customer Name. You need to create the following visualization.

正解:
解説:
質問 # 40
You are developing a data source in Tableau Prep.
You have two tables named Orders and Employees.
The Orders table was created in 2019 and contains the following columns.
The Employees table contains all the employee information for the various sales teams in the sales department and contains the following columns
You want to prepare the data so that you can analyze sales trends over time for every sales team.
Which three actions should you perform in order? (Place the three correct options in order. Use the arrows to move Options to Answer Are a. Use Answer Area arrows to re-order the options.)

正解:
解説:
1 - Join the tables.
2 - Aggregate the data by Sales Team.
3 - Add the following filter to the Employees table: Sale Team - Team Alpha.
Reference:
[Tableau Certified Data Analyst Exam Prep Guide], page 9, section "Preparing Data"
[Tableau Help: Join Your Data]
[Tableau Help: Aggregate Your Data]
[Tableau Help: Filter Your Data]
質問 # 41
You have the following dataset.
You want to create a new calculated dimension field named Category that meets the following conditions:
. When Subject is Computer Science or Science, Category must be Sciences.
. When Subject is English or Social Studies, Category must be Humanities.
Which two logical functions achieve the goal? Choose two.
- A. IIF(( CONTAINS ([Subject], 'Science') = TRUE) , 'Humanities', 'Sciences')
- B. IF ENDSWITH ( [Subject], 'Computer Science') THEN 'Sciences' ELSE 'Humanities' END
- C. CASE [Subject]
WHEN 'Computer Science' THEN 'Sciences'
WHEN 'Science' THEN 'Sciences'
WHEN 'English' THEN 'Humanities'
WHEN 'Social Studies' THEN 'Humanities'
End - D. IF [Subject]- 'Science' THEN 'Sciences'
ELSEIF [Subject]='English' THEN 'Humanities'
ELSEIF [Subject]-'Social Studies' THEN 'Humanities'
ELSEIF [Subject]= 'Computer Science' THEN 'Sciences'
END
正解:C、D
解説:
To create a new calculated dimension field named Category that meets the given conditions, you can use either the IF or the CASE logical function. Both functions allow you to evaluate an expression and return a value based on different scenarios. Option A uses the IF function with multiple ELSEIF clauses to check the value of the Subject field and assign it to either 'Sciences' or 'Humanities'. Option D uses the CASE function with multiple WHEN clauses to do the same thing. Both options will produce the same result, but the CASE function is more concise and easier to read. Option B is incorrect because it will assign 'Humanities' to any subject that contains 'Science' in its name, which is not the desired outcome. Option C is incorrect because it will only check if the subject ends with 'Computer Science' and ignore the other subjects. References:
Logical Functions - Tableau
Tableau Certified Data Analyst Study Guide
質問 # 42
You have the following dataset.

When you use the dataset in a worksheet, you want Sales to appear automatically as shown in the following table.
What should you do?
- A. Change the data type of the Sates field to Siring
- B. Create a calculated field that uses a formula of 'S' * str (Round((sales],2)) + 'k'
- C. Create a calculated field that uses a formula of 'S' + stri < (Sales)/1000)).
- D. Change the default number format of the Sales told
正解:D
解説:
To make Sales appear automatically as shown in the second table, you should change the default number format of the Sales field. The default number format is how Tableau displays a field when you drag it to a worksheet. You can change the default number format by right-clicking on the field and selecting Default Properties > Number Format from the menu. This will open a dialog box where you can choose a category, such as Currency or Percentage, and customize the options, such as decimal places or prefixes.
In this case, you want to change the default number format of Sales to Currency with zero decimal places and a custom prefix of "S". This will make Sales appear as "S" followed by the rounded value in thousands.
The other options are not correct for this scenario. Changing the data type of Sales to String will not affect how it appears on a worksheet. Creating a calculated field that uses a formula will not change the default number format of Sales, but create a new field that you have to drag to a worksheet. Converting Sales to Attribute will return only one value for each partition of data, which will not show any variation over time. Reference: https://help.tableau.com/current/pro/desktop/en-us/formatting.htm https://help.tableau.com/current/pro/desktop/en-us/formatting_change_default.htm
質問 # 43
You have the following box plot that shows the distribution of average profits made in every state by region.
Which region has the smallest distribution of profits?
- A. South
- B. Central
- C. Cast
- D. West
正解:A
解説:
The box plot visualization displays the distribution of average profits by region. The distribution of profits is represented by the range of the box (interquartile range) and the whiskers (which often represent the total range excluding outliers). From the image provided, the South region has the smallest visible range within its box and the shortest whiskers, indicating the smallest distribution of average profits among the choices provided.
質問 # 44
You have a dataset that contains sates dat
a. The following is a sample of the data.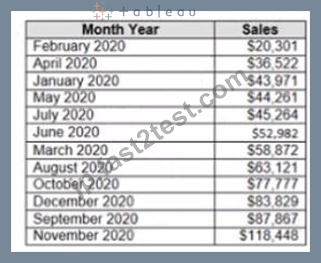
You need to return a value of true if a month has sales greater than $50 000. otherwise the formula must return a value of false.
Which two formulas achieve the goal Choose two
- A. SUM{[Sales]) IN (50000)
- B. MAX< [Sales], 50000)
- C. IIF(SUM< [Sales] )>50000, TRUE, FALSE)
- D. [Sales] > 50000
正解:C、D
解説:
B) IIF(SUM([Sales]) > 50000, TRUE, FALSE)
D) [Sales] > 50000
The IIF function is a logical function that returns one value if a condition is true, and another value if the condition is false. In this case, the condition is SUM([Sales]) > 50000, which means that the sum of sales for a month is greater than $50,000. The function will return TRUE if the condition is true, and FALSE if the condition is false.
The comparison operator > is a logical operator that returns TRUE if the left operand is greater than the right operand, and FALSE otherwise. In this case, the operands are [Sales] and 50000, which means that the sales for a month are greater than $50,000. The operator will return TRUE if the sales are greater than $50,000, and FALSE otherwise.
The other options are not correct for this scenario. The IN function is a logical function that returns TRUE if a value is in a set of values, and FALSE otherwise. In this case, the value is SUM([Sales]), which is not in the set of values (50000). The function will always return FALSE. The MAX function is an aggregation function that returns the maximum value in a field or expression. In this case, the field or expression is [Sales], 50000, which is not valid syntax. The function will return an error. Reference: https://help.tableau.com/current/pro/desktop/en-us/functions_functions_logical.htm#IIF https://help.tableau.com/current/pro/desktop/en-us/operators.htm https://help.tableau.com/current/pro/desktop/en-us/functions_functions_aggregate.htm#MAX Explanation:
The two formulas that will return a value of true if a month has sales greater than $50,000, otherwise the formula must return a value of false, are:
質問 # 45
You have the following dashboard.
Currently the map is used as a filter that affects the data on the otter sheets of the dashboard You need to configure the dashboard to ensure that selecting a data point on the map only tillers the Detail table What should you do?
- A. From the context menu of Sales over time select Ignore Actions
- B. From the context menu of Sales over lime select Remove Dashboard Item
- C. From the context menu of Sales over time select Deselect
- D. From the context menu of Profits by Stale deselect Use as Filter
正解:A
質問 # 46
You have the following dataset.
You want to create a new calculated dimension field named Category that meets the following conditions:
. When Subject is Computer Science or Science, Category must be Sciences.
. When Subject is English or Social Studies, Category must be Humanities.
Which two logical functions achieve the goal? Choose two.
- A. IIF(( CONTAINS ([Subject], 'Science') = TRUE) , 'Humanities', 'Sciences')
- B. IF ENDSWITH ( [Subject], 'Computer Science') THEN 'Sciences' ELSE 'Humanities' END
- C. IF [Subject]- 'Science' THEN 'Sciences'
ELSEIF [Subject]='English' THEN 'Humanities'
ELSEIF [Subject]-'Social Studies' THEN 'Humanities'
ELSEIF [Subject]= 'Computer Science' THEN 'Sciences'
END - D. CASE [Subject]
WHEN 'Computer Science' THEN 'Sciences'
WHEN 'Science' THEN 'Sciences'
WHEN 'English' THEN 'Humanities'
WHEN 'Social Studies' THEN 'Humanities'
正解:C、D
解説:
End
Explanation:
To create a new calculated dimension field named Category that meets the given conditions, you can use either the IF or the CASE logical function. Both functions allow you to evaluate an expression and return a value based on different scenarios. Option A uses the IF function with multiple ELSEIF clauses to check the value of the Subject field and assign it to either 'Sciences' or 'Humanities'. Option D uses the CASE function with multiple WHEN clauses to do the same thing. Both options will produce the same result, but the CASE function is more concise and easier to read. Option B is incorrect because it will assign 'Humanities' to any subject that contains 'Science' in its name, which is not the desired outcome. Option C is incorrect because it will only check if the subject ends with 'Computer Science' and ignore the other subjects. Reference:
Logical Functions - Tableau
Tableau Certified Data Analyst Study Guide
質問 # 47
You have the following dashboard that contains two visualizations.
You want to show only one visualization at time. Users must be able to switch between visualizations.
What should you me?
- A. A parameter and a calculated filed
- B. Show/hide buttons
- C. Dashboard actions
- D. Worksheet actions
正解:B
解説:
In Tableau, you can manage the visibility of different visualizations on a dashboard using various techniques.
Among the options provided, the most straightforward method to allow users to switch between two visualizations is to use show/hide buttons.
Here's why each option is or isn't suitable for the requirement:
A). A parameter and a calculated field: While it's possible to use a parameter and a calculated field to control which visualization is displayed, it requires creating a calculated field that responds to a parameter and then using that field to filter the view. This method can become complex and is not as user-friendly for simply showing and hiding visualizations.
B). Worksheet actions: Worksheet actions in Tableau typically allow users to interact with the data within a visualization, such as filtering data or highlighting related data points when clicking or hovering. They are not designed to control the visibility of entire visualizations on a dashboard.
C). Show/hide buttons: Show/hide buttons are a feature specifically designed to manage the visibility of dashboard elements. When you create a show/hide button, it can be configured to display or hide a particular visualization, container, or any other dashboard element when clicked. This provides a very intuitive interface for users to switch between visualizations.
D). Dashboard actions: Dashboard actions, like worksheet actions, are used to create interactions between sheets, such as filtering data or navigating to other sheets or URLs based on user interactions. They are not intended for toggling the visibility of visualizations.
Therefore, the correct answer is C. Show/hide buttons as they provide a user-friendly way to switch between visualizations on a dashboard without the need for complex calculations or actions that aren't meant for this purpose. The show/hide button feature is specifically designed for toggling visibility and offers a simple and effective solution for the requirement.
質問 # 48
You have a data source that contains the following columns.
You want to filter regions based on the highest sales. Users must be able to specify the number of regions shown.
Which three actions should you perform in order? (Place the three correct options in order. Use the arrows to move Options to Answer Area.
Use Answer Area arrows to re-order the options.)
正解:
解説:
1 - Create an integer data type parameter named Param1
2 - Drag Region to the Filters shelf.
3 - Configure a Top filter by field. Use Param1 and filter by the sum of Sales.
Reference:
Tableau Certified Data Analyst Exam Prep Guide, page 10, section "Filtering Data" Tableau Help: Parameters Tableau Help: Top Filters
質問 # 49
You have a dataset that contains daily sales by business segment from 2017 to the present You want to use monthly historical trends to predict sales by segment in the future Which three actions should you perform m order?
(Place the three correct options in order Use the arrows to move Options lo Answer Area I In Answer Area arrows to re order the options.)
正解:
解説:
1 - Aggregate the date to month and year.
2 - Create a calculated field that uses the MODEL_QUANTILE function.
3 - Add the date to the Columns sfelf. Add the segment and the sales to the Rows shelf.
質問 # 50
......
TDA-C01問題集を無料PDFゲットせよ最近更新された問題:https://jp.fast2test.com/TDA-C01-premium-file.html
TDA-C01ブレーン問題集で学習ガイドには試験合格するための秘訣:https://drive.google.com/open?id=17hh7ZSH0g7ZeatO2QP7O403yh-Buq4lc