

[2023年12月20日] DP-500テストエンジンお試しセット、DP-500問題集PDF
最新のMicrosoft DP-500のPDFと問題集で(2023)無料試験問題解答
質問 # 57
You need to create Power Bl reports that will display data based on the customers' subscription level.
Which three actions should you perform in sequence? To answer, move the appropriate actions from the list of
actions to the answer area and arrange them in the correct order.
正解:
解説: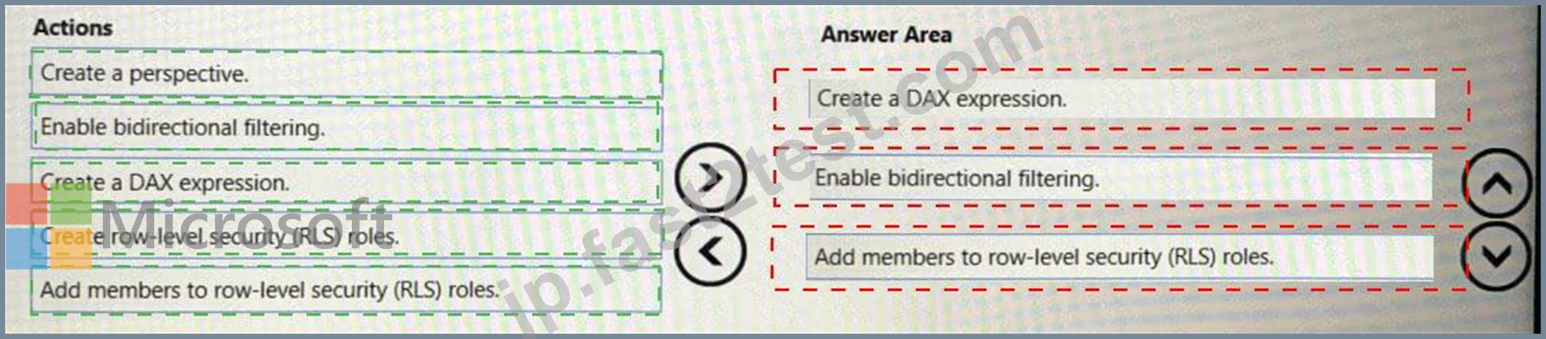
質問 # 58
You have an Azure Synapse Analytics workspace that is connected to an Azure Data Lake Storage Gen2 account.
From Synapse Studio, you run the following query.
You need to create a column chart to visualize the changes in gross revenue over time.
How should you populate the chart? To answer, drag the appropriate columns to the correct settings. Each column may be used once, more than once, or not at all. You may need to drag the split bar between panes or scroll to view content.
NOTE: Each correct selection is worth one point.
正解:
解説:
Explanation
質問 # 59
You have the following Python code in an Apache Spark notebook.
Which type of chart will the code produce?
- A. a stacked bar chart
- B. a bar chart
- C. a pie chart
- D. an area chart
正解:D
解説:
Explanation
The matplotlib.pyplot.fill_between function fills the area between two horizontal curves.
The curves are defined by the points (x, y1) and (x, y2). This creates one or multiple polygons describing the filled area.
Reference: https://matplotlib.org/3.5.0/api/_as_gen/matplotlib.pyplot.fill_between.html
質問 # 60
You need to implement object-level security (OLS) in the Power Bl dataset for the sales associates.
Which three actions should you perform in sequence? To answer, move the appropriate actions from the list of actions to the answer area and arrange them in the correct order.
正解:
解説:
1 - From Power BI Desktop, create a role for the sales associates.
2 - From Tabular Editor, set Object Level Security to None for the Customer[Email] column and save the changes.
3 - From Power Bl Desktop, publish the dataset to the sales analytics workspace.
質問 # 61
You have a Power Bl report that contains the visual shown in the following exhibit.
You need to make the visual more accessible to users who have color vision deficiency. What should you do?
- A. Change the font color of values in the Sales column to white.
- B. Change the red background color to orange.
- C. Add additional measures to the table values.
- D. Add icons to represent the sales status of each product.
正解:A
解説:
Explanation
Themes, contrast and colorblind-friendly colors
You should ensure that your reports have enough contrast between text and any background colors.
Certain color combinations are particularly difficult for users with color vision deficiencies to distinguish.
These include the following combinations:
**---> green and black
green and red
green and brown
blue and purple
green and blue
light green and yellow
blue and grey
green and grey
Avoid using these colors together in a chart, or on the same report page.
Reference: https://docs.microsoft.com/en-us/power-bi/create-reports/desktop-accessibility-creating-reports
質問 # 62
You have a dataset that contains a table named UserPermissions. UserPermissions contains the following data.
You plan to create a security role named User Security for the dataset. You need to filter the dataset based on the current users. What should you include in the DAX expression?
- A. [User] = USERNAME()
- B. [UserPermissions] - USERPRINCIPALNAME()
- C. [UserPermissions] - USERNAME()
- D. [User] = USERPRINCIPALNAME()
- E. [User] = USEROBJECTID()
正解:A
解説:
Explanation
USERNAME() returns the domain name and username from the credentials given to the system at connection time.
It should be compared to column name of User, which in DAX is expressed through [User].
Reference: https://docs.microsoft.com/en-us/dax/username-function-dax
質問 # 63
You have the following Python code in an Apache Spark notebook.
Which type of chart will the code produce?
- A. a stacked bar chart
- B. a bar chart
- C. a pie chart
- D. an area chart
正解:D
解説:
Explanation
The matplotlib.pyplot.fill_between function fills the area between two horizontal curves.
The curves are defined by the points (x, y1) and (x, y2). This creates one or multiple polygons describing the filled area.
Reference: https://matplotlib.org/3.5.0/api/_as_gen/matplotlib.pyplot.fill_between.html
質問 # 64
You have a sales report as shown in the following exhibit.
The sales report has the following characteristics:
The measures are optimized.
The dataset uses import storage mode.
Data points, hierarchies, and fields cannot be removed or filtered from the report page.
From powerbi.com, users experience slow load times when viewing the report.
You need to reduce how long it takes for the report to load without affecting the data displayed in the report.
Which two actions should you perform? Each correct answer presents part of the solution.
NOTE: Each correct selection is worth one point.
- A. Change the report theme to monochromatic.
- B. Replace the single-value cards with a multi-row card.
- C. Replace the product category charts with a bar chart for sales and a hierarchy of Category and Sub Category on the axis.
- D. Replace all the filters on the Filters pane with visual slicers on the report page.
正解:B、C
質問 # 65
You need to recommend a solution for the customer workspaces to support the planned changes.
Which two configurations should you include in the recommendation? Each correct answer presents part of the solution.
NOTE: Each correct selection is worth one point.
- A. Grant the Build permission for the financial data to each customer.
- B. Set Use datasets across workspaces to Enabled
- C. Publish the financial data to the web.
- D. Configure the FinData workspace to use a Power Bl Premium capacity.
正解:B、D
解説:
Explanation
Build a new dataset in the FinData workspace by using data from the Synapse Analytics dedicated SQL pool.
Provide all the customers with their own Power BI workspace to create their own reports. Each workspace will use the new dataset in the FinData workspace Reference: https://docs.microsoft.com/en-us/power-bi/connect-data/service-datasets-admin-across-workspaces
質問 # 66
You have a Power Bl dataset that has only the necessary fields visible for report development.
You need to ensure that end users see only 25 specific fields that they can use to personalize visuals.
What should you do?
- A. From Tabular Editor, create a new perspective.
- B. From Tabular Editor, create a new role.
- C. Hide all the fields in the dataset.
- D. Configure object-level security (OLS).
正解:C
質問 # 67
You are planning a Power Bl solution for a customer.
The customer will have 200 Power Bl users. The customer identifies the following requirements:
* Ensure that all the users can create paginated reports.
* Ensure that the users can create reports containing Al visuals.
* Provide autoscaling of the CPU resources during heavy usage spikes.
You need to recommend a Power Bl solution for the customer. The solution must minimize costs. What should you recommend?
- A. a Power Bl Premium per capacity
- B. Power Bl Pro per user
- C. Power Bl Premium per user
- D. Power Bl Report Server
正解:C
解説:
Announcing Power BI Premium Per User general availability and autoscale preview for Gen2.
Power BI Premium per user features and capabilities
* Pixel perfect paginated reports are available for operational reporting capabilities based on SSRS technology. Users can create highly formatted reports in various formats such as PDF and PPT, which are embeddable in applications and are designed to be printed or shared.
* Automated machine learning (AutoML) in Power BI enables business users to build ML models to predict outcomes without having to write any code.
* Etc.
Note:
Power BI empowers every business user and business analyst to get amazing insights with AI infused experiences. With Power BI Premium, we enable business analysts to not only analyze and visualize their data, but to also build an end-to-end data platform through drag and drop experiences. Everything from ingesting and transforming data at scale, to building automated machine learning models, and analyzing massive volumes of data is now possible for our millions of business analysts.
質問 # 68
You have a Power Bl workspace that contains one dataset and four reports that connect to the dataset. The dataset uses Import storage mode and contains the following data sources:
* A CSV file in an Azure Storage account
* An Azure Database for PostgreSQL database
You plan to use deployment pipelines to promote the content from development to test to production. There will be different data source locations for each stage. What should you include in the deployment pipeline to ensure that the appropriate data source locations are used during each stage?
- A. selective deployment
- B. parameter rules
- C. auto-binding across pipelines
- D. data source rules
正解:B
解説:
Note: Create deployment rules
When working in a deployment pipeline, different stages may have different configurations. For example, each stage can have different databases or different query parameters. The development stage might query sample data from the database, while the test and production stages query the entire database.
When you deploy content between pipeline stages, configuring deployment rules enables you to allow changes to content, while keeping some settings intact. For example, if you want a dataset in a production stage to point to a production database, you can define a rule for this. The rule is defined in the production stage, under the appropriate dataset. Once the rule is defined, content deployed from test to production, will inherit the value as defined in the deployment rule, and will always apply as long as the rule is unchanged and valid.
質問 # 69
Note: This question is part of a series of questions that present the same scenario. Each question in the series contains a unique solution that might meet the stated goals. Some question sets might have more than one correct solution, while others might not have a correct solution.
After you answer a question in this section, you will NOT be able to return to it. As a result, these questions will not appear in the review screen.
You have the Power Bl data model shown in the exhibit. (Click the Exhibit tab.)
Users indicate that when they build reports from the data model, the reports take a long time to load.
You need to recommend a solution to reduce the load times of the reports.
Solution: You recommend normalizing the data model.
Does this meet the goal?
- A. Yes
- B. No
正解:B
解説:
Explanation
Instead denormalize For Performance.
Even though it might mean storing a bit of redundant data, schema denormalization can sometimes provide better query performance. The only question then becomes is the extra space used worth the performance benefit.
Reference: https://www.mssqltips.com/sqlservertutorial/3211/denormalize-for-performance/
質問 # 70
You have a deployment pipeline for a Power BI workspace. The workspace contains two datasets that use import storage mode.
A database administrator reports a drastic increase in the number of queries sent from the Power Bi service to an Azure SQL database since the creation of the deployment pipeline.
An investigation into the issue identifies the following:
One of the datasets is larger than 1 GB and has a fact table that contains more than 500 million rows.
When publishing dataset changes to development, test, or production pipelines, a refresh is triggered against the entire dataset.
You need to recommend a solution to reduce the size of the queries sent to the database when the dataset changes are published to development, test, or production.
What should you recommend?
- A. In the dataset, delete the fact table.
- B. Configure the dataset to use a composite model that has a DirectQuery connection to the fact table.
- C. Request the authors of the deployment pipeline datasets to reduce the number of datasets republished during development.
- D. From Capacity settings in the Power Bi Admin portal, reduce the Max Intermediate Row Set Count setting.
正解:B
解説:
Previously in Power BI Desktop, when you used a DirectQuery in a report, no other data connections, whether DirectQuery or import, were allowed for that report. With composite models, that restriction is removed. A report can seamlessly include data connections from more than one DirectQuery or import data connection, in any combination you choose.
The composite models capability in Power BI Desktop consists of three related features:
* Composite models: Allows a report to have two or more data connections from different source groups, such as one or more DirectQuery connections and an import connection, two or more DirectQuery connections, or any combination thereof.
* Etc.
質問 # 71
You are using a Python notebook in an Apache Spark pool in Azure Synapse Analytics.
You need to present the data distribution statistics from a DataFrame in a tabular view.
Which method should you invoke on the DataFrame?
- A. describe
- B. sample
- C. freqltems
- D. explain
正解:A
解説:
pandas.DataFrame.describe
Descriptive statistics include those that summarize the central tendency, dispersion and shape of a dataset's distribution, excluding NaN values.
Analyzes both numeric and object series, as well as DataFrame column sets of mixed data types. The output will vary depending on what is provided.
質問 # 72
You are configuring an aggregation table as shown in the following exhibit.
The detail table is named FactSales and the aggregation table is named FactSales(Agg).
You need to aggregate SalesAmount for each store.
Which type of summarization should you use for SalesAmount and StoreKey? To answer, select the appropriate options in the answer area, NOTE: Each correct selection is worth one point.
正解:
解説:
質問 # 73
......
Microsoft DP-500試験は、データストレージソリューション、データ処理、データの視覚化など、幅広いトピックをカバーする包括的なテストです。この認定試験は、データ管理、データ倉庫、データの視覚化など、データ分析のさまざまな分野の専門家のスキルをテストするように設計されています。
あなたを合格させるAzure Enterprise Data Analyst Associate DP-500試験問題集で2023年12月20日には150問あります:https://jp.fast2test.com/DP-500-premium-file.html
DP-500無料試験学習ガイド!(更新された150問あります):https://drive.google.com/open?id=1njUFlD9HKIGozaydmvGQylL2CkjoU083