

更新された2024年08月16日検証済み!合格できるDP-500試験一発合格保証付き
無料で使えるDP-500サンプルには問題100%カバー率でリアル試験問題(更新された164問あります)
この試験は、Microsoft AzureとMicrosoft Power BIを使用して、エンタープライズスケール分析ソリューションの設計と実装の経験がある専門家のスキルをテストするように設計されています。この認定試験を受ける個人は、データを操作した経験があり、データ分析の概念を十分に理解することをお勧めします。
質問 # 81
You need to recommend a solution to add new fields to the financial data Power Bl dataset with data from the Microsoft SQL Server data warehouse.
What should you include in the recommendation?
- A. Azure Purview
- B. an XMLA endpoint
- C. the on-premises data gateway
- D. Site-to-Site VPN
正解:C
解説:
Refresh data from an on-premises SQL Server database
The SQL Server database must be accessed by Power BI through an on-premises data gateway.
You can install an on-premises data gateway on the same local computer as SQL Server (in production, it would typically be a different computer).
質問 # 82
You have a deployment pipeline for a Power BI workspace. The workspace contains two datasets that use import storage mode.
A database administrator reports a drastic increase in the number of queries sent from the Power BI service to an Azure SQL database since the creation of the deployment pipeline.
An investigation into the issue identifies the following:
One of the datasets is larger than 1 GB and has a fact table that contains more than 500 million rows.
When publishing dataset changes to development, test, or production pipelines, a refresh is triggered against the entire dataset.
You need to recommend a solution to reduce the size of the queries sent to the database when the dataset changes are published to development, test, or production.
What should you recommend?
- A. From Capacity settings in the Power Bl Admin portal, reduce the Max Intermediate Row Set Count setting.
- B. Enable the large dataset storage format for workspace.
- C. From Capacity settings in the Power Bl Admin portal, increase the Max Intermediate Row Set Count setting.
- D. Configure the dataset to use a composite model that has a DirectQuery connection to the fact table.
正解:D
解説:
A composite model in Power BI means part of your model can be a DirectQuery connection to a data source (for example, SQL Server database), and another part as Import Data (for example, an Excel file). Previously, when you used DirectQuery, you couldn't even add another data source into the model.
DirectQuery and Import Data have different advantages.
Now the Composite Model combines the good things of both Import and DirectQuery into one model. Using the Composite Model, you can work with big data tables using DirectQuery, and still import smaller tables using Import Data.
Reference:
https://powerbi.microsoft.com/en-us/blog/five-new-power-bi-premium-capacity-settings-is-available-on-the-portal-preloaded-with-default-values-admin-can-review-and-override-the-defaults-with-their-preference-to-better-fence-their-capacity/
質問 # 83
You have a kiosk that displays a Power Bl report page. The report uses a dataset that uses Import storage mode. You need to ensure that the report page updates all the visuals every 30 minutes. Which two actions should you perform? Each correct answer presents part of the solution. NOTE: Each correct selection is worth one point.
- A. Configure the data sources to use DirectQuery.
- B. Enable the XMIA endpoint.
- C. Enable Power Bl embedded.
- D. Select Auto page refresh.
- E. Add a Microsoft Power Automate visual to the report page.
- F. Configure the data sources to use a streaming dataset
正解:A、D
解説:
Explanation
Automatic page refresh in Power BI enables your active report page to query for new data, at a predefined cadence, for DirectQuery sources.
Automatic page refresh is available for DirectQuery sources and some LiveConnect scenarios, so it will only be available when you are connected to a supported data source. This restriction applies to both automatic page refresh types.
Reference: https://docs.microsoft.com/en-us/power-bi/create-reports/desktop-automatic-page-refresh
Topic 2, Litware, Inc. Overview
Litware, Inc. is a retail company that sells outdoor recreational goods and accessories. The company sells goods both online and at its stores located in six countries.
Azure Resources
Litware has the following Azure resources:
* An Azure Synapse Analytics workspace named synapseworkspace1
* An Azure Data Lake Storage Gen2 account named datalake1 that is associated with synapseworkspace1
* A Synapse Analytics dedicated SQL pool named SQLDW
Dedicated SQL Pool
SQLDW contains a dimensional model that contains the following table.
SQLDW contains the following additional tables.
SQLDW contains a view named dbo.CustomerPurchases that creates a distinct list of values from dbo.Customer [customeriD], dbo.Customer
[CustomerEmail], dbo.ProductfProductID] and dbo.Product[ProductName].
The sales data in SQLDW is updated every 30 minutes. Records in dbo.SalesTransactions are updated in SQLDW up to three days after being created. The records do NOT change after three days.
Power BI
Litware has a new Power Bl tenant that contains an empty workspace named Sales Analytics.
All users have Power B1 Premium per user licenses.
IT data analysts are workspace administrators. The IT data analysts will create datasets and reports.
A single imported dataset will be created to support the company's sales analytics goals. The dataset will be refreshed every 30 minutes.
Analytics Goals
Litware identifies the following analytics goals:
* Provide historical reporting of sales by product and channel over time.
* Allow sales managers to perform ad hoc sales reporting with minimal effort.
* Perform market basket analysis to understand which products are commonly purchased in the same transaction.
* Identify which customers should receive promotional emails based on their likelihood of purchasing promoted products.
Litware plans to monitor the adoption of Power Bl reports over time. The company wants custom Power Bl usage reporting that includes the percent change of users that view reports in the Sales Analytics workspace each month.
Security Requirements
Litware identifies the following security requirements for the analytics environment:
* All the users in the sales department and the marketing department must be able to see Power B1 reports that contain market basket analysis and data about which customers are likely to purchase a product.
* Customer contact data in SQLDW and the Power B1 dataset must be labeled as Sensitive. Records must be kept of any users that use the sensitive data.
* Sales associates must be prevented from seeing the CustomerEmail column in Power B1 reports.
* Sales managers must be prevented from modifying reports created by other users.
Development Process Requirements
Litware identifies the following development process requirements:
* SQLDW and datalake1 will act as the development environment. Once feature development is complete, all entities in synapseworkspace1 will be promoted to a test workspace, and then to a production workspace.
* Power Bl content must be deployed to test and production by using deployment pipelines.
* All SQL scripts must be stored in Azure Repos.
The IT data analysts prefer to build Power Bl reports in Synapse Studio.
質問 # 84
You need to implement object-level security (OLS) in the Power Bl dataset for the sales associates.
Which three actions should you perform in sequence? To answer, move the appropriate actions from the list of actions to the answer area and arrange them in the correct order.
正解:
解説:
1 - From Power BI Desktop, create a role for the sales associates.
2 - From Tabular Editor, set Object Level Security to None for the Customer[Email] column and save the changes.
3 - From Power BI Desktop, publish the dataset to the Sales Analytics workspace.
質問 # 85
After you answer a question in this section, you will NOT be able to return to it. As a result, these questions will not appear in the review screen.
You are using an Azure Synapse Analytics serverless SQL pool to query a collection of Apache Parquet files by using automatic schema inference. The files contain more than 40 million rows of UTF-8-encoded business names, survey names, and participant counts. The database is configured to use the default collation.
The queries use open row set and infer the schema shown in the following table.
You need to recommend changes to the queries to reduce I/O reads and tempdb usage.
Solution: You recommend defining an external table for the Parquet files and updating the query to use the table Does this meet the goal?
- A. Yes
- B. No
正解:B
質問 # 86
You have a Power Bl dataset that contains the following measures:
* Budget
* Actuals
* Forecast
You create a report that contains 10 visuals.
You need provide users with the ability to use a slicer to switch between the measures in two visuals only.
You create a dedicated measure named cg Measure switch.
How should you complete the DAX expression for the Actuals measure? To answer, drag the appropriate values to the targets. Each value may be used once, more than once, or not at all. You may need to drag the split bar between panes or scroll to view content.
NOTE: Each correct selection is worth one point.
正解:
解説:
Reference:
https://docs.microsoft.com/en-us/dax/selectedvalue-function
質問 # 87
You plan to create a Power Bl report that will use an OData feed as the data source. You will retrieve all the entities from two different collections by using the same service root The OData feed is still in development. The location of the feed will change once development is complete.
The report will be published before the OData feed development is complete.
You need to minimize development effort to change the data source once the location changes.
Which three actions should you perform in sequence? To answer, move the appropriate actions from the list of actions to the answer area and arrange them in the correct order.
正解:
解説:
1 - Create a parameter that contains the service root URI.
2 - Get data from OData feed source and use the parameter to populate the first part of the URL.
3 - From Advanced Editor, duplicate the query and change the resource path in the URL.
質問 # 88
You have a Power Bl report that contains one visual.
You need to provide users with the ability to change the visual type without affecting the view for other users.
What should you do?
- A. From Report setting, select Personalize visuals.
- B. From Visual options in Report settings, select Use the modern visual header with updated styling options.
- C. From the Bookmarks pane, select Focus mode, and then select Add.
- D. From Tabular Editor, create a new perspective.
正解:A
解説:
Enable personalization in a report
You can enable the feature either in Power BI Desktop or the Power BI service. You can also enable it in embedded reports.
To enable the feature in Power BI Desktop, go to File > Options and settings > Options > Current file > Report settings. Make sure Personalize visuals is turned on.
質問 # 89
You use an Apache Spark notebook in Azure Synapse Analytics to filter and transform data.
You need to review statistics for a DataFrame that includes:
The column name
The column type
The number of distinct values
Whether the column has missing values
Which function should you use?
- A. display(df)
- B. display(df, summary=true)
- C. displayHTML()
- D. %%configure
- E. %%lsmagic
正解:B
質問 # 90
You have an Azure Synapse notebook.
You need to create the visual shown in the following exhibit.
How should you complete the code? To answer, select the appropriate options in the answer area.
NOTE: Each correct selection is worth one point.
正解:
解説:
Explanation
Box 1: fill_between
atplotlib.pyplot.fill_between fills the area between two horizontal curves.
The curves are defined by the points (x, y1) and (x, y2). This creates one or multiple polygons describing the filled area.
Box 2: suptitle
Set the title of the visual.
suptitle adds a centred title to the figure.
Reference:
https://matplotlib.org/3.1.1/api/_as_gen/matplotlib.pyplot.fill_between.html#matplotlib.pyplot.fill_between
https://matplotlib.org/3.1.1/api/_as_gen/matplotlib.pyplot.suptitle.html#matplotlib.pyplot.suptitle
質問 # 91
You have five Power Bl reports that contain R script data sources and R visuals.
You need to publish the reports to the Power Bl service and configure a daily refresh of datasets.
What should you include in the solution?
- A. a workspace that connects to an Azure Data Lake Storage Gen2 account
- B. a Power Bl Embedded capacity
- C. an on-premises data gateway (personal mode)
- D. an on-premises data gateway (standard mode)
正解:A
解説:
Explanation
To schedule refresh of your R visuals or dataset, enable scheduled refresh and install an on-premises data gateway (personal mode) on the computer containing the workbook and R.
Reference: https://docs.microsoft.com/en-us/power-bi/connect-data/desktop-r-in-query-editor
質問 # 92
Note: This question is part of a series of questions that present the same scenario. Each question in the series contains a unique solution that might meet the stated goals. Some question sets might have more than one correct solution, while others might not have a correct solution.
After you answer a question in this section, you will NOT be able to return to it. As a result, these questions will not appear in the review screen.
You have the Power BI data model shown in the exhibit (Click the Exhibit tab.)
Users indicate that when they build reports from the data model, the reports take a long time to load.
You need to recommend a solution to reduce the load times of the reports.
Solution: You recommend denormalizing the data model.
Does this meet the goal?
- A. No
- B. Yes
正解:B
解説:
Denormalize For Performance.
Even though it might mean storing a bit of redundant data, schema denormalization can sometimes provide better query performance. The only question then becomes is the extra space used worth the performance benefit.
質問 # 93
You are configuring Azure Synapse Analytics pools to support the Azure Active Directory groups shown in the following table.
Which type of pool should each group use? To answer, drag the appropriate pool types to the groups. Each pool type may be used once, more than once, or not at all. You may need to drag the split bar between panes or scroll to view content.
NOTE: Each correct selection is worth one point.
正解:
解説:
Explanation
Box 1: Apache Spark pool
An Apache Spark pool provides open-source big data compute capabilities. After you've created an Apache Spark pool in your Synapse workspace, data can be loaded, modeled, processed, and distributed for faster analytic insight.
Box 2: Dedicated SQL Pool
Dedicated SQL Pool - Data is stored in relational tables
Box 3: Serverless SQL pool
Serverless SQL pool - Cost is incurred for the data processed per query Reference:
https://docs.microsoft.com/en-us/azure/synapse-analytics/quickstart-create-apache-spark-pool-portal
https://www.royalcyber.com/blog/data-services/dedicated-sql-pool-vs-serverless-sql/
質問 # 94
You use the Vertipaq Analyzer to analyze tables in a dataset as shown in the Tables exhibit. (Click the Tables tab.)
The table relationships for the dataset are shown in the Relationships exhibit. (Click the Relationships tab.)
You need to reduce the model size by eliminating invalid relationships.
Which column should you remove?
- A. Sales[RowlD]
- B. Sales[Sales ID]
- C. Plan[RowlD]
- D. Sales[Sales Amount]
正解:B
解説:
Sales[Row ID] has 858,786 missing keys and 858,789 Max From Cardinality.
Note: The Max From Cardinality column defines the cost of the relationship which is the amount of time DAX needs to transfer the filters from the dimensions table to the fact table.
質問 # 95
You plan to generate a line chart to visualize and compare the last six months of sales data for two departments. You need to increase the accessibility of the visual. What should you do?
- A. Move important information to a tooltip.
- B. Configure a distinct color for each series.
- C. Configure a unique marker for each series.
- D. Replace long text with abbreviations and acronyms.
正解:B
解説:
Explanation
Themes, contrast and colorblind-friendly colors.
You should ensure that your reports have enough contrast between text and any background colors.
Certain color combinations are particularly difficult for users with color vision deficiencies to distinguish.
These include the following combinations:
green and red
green and brown
blue and purple
green and blue
light green and yellow
blue and grey
green and grey
green and black
Avoid using these colors together in a chart, or on the same report page.
Reference: https://docs.microsoft.com/en-us/power-bi/create-reports/desktop-accessibility-creating-reports
質問 # 96
You use Advanced Editor in Power Query Editor to edit a query that references two tables named Sales and
Commission. A sample of the data in the Sales table is shown in the following table.
A sample of the data in the Commission table is shown in the following table.
You need to merge the tables by using Power Query Editor without losing any rows in the Sales table.
How should you complete the query? To answer, select the appropriate options in the answer area.
NOTE: Each correct selection is worth one point.
正解:
解説:
質問 # 97
You have a Power Bl dataset that contains the following measure.
You need to improve the performance of the measure without affecting the logic or the results. What should you do?
- A. Replace both calculate functions by using a variable that contains the calculate function.
- B. Remove the alternative result of blank( ) from the divide function.
- C. Create a variable and replace the values for [sales Amount].
- D. Remove "calendar'[Flag] = "YTD" from the code.
正解:A
質問 # 98
You have the following code in an Azure Synapse notebook.
Use the drop-down menus to select the answer choice that completes each statement based on the information presented in the code.
NOTE: Each correct selection is worth one point.
正解:
解説:
Reference:
https://matplotlib.org/stable/gallery/lines_bars_and_markers/bar_stacked.html
https://matplotlib.org/stable/api/legend_api.html
質問 # 99
You manage a dataset that contains the two data sources as shown in the following table.
When you attempt to refresh the dataset in powerbi.com, you receive the following error message: "[Unable to combine data] Add Columns is accessing data sources that have privacy levels which cannot be used together. Please rebuild this data combination." You discover that the dataset contains queries that fold data from the SharePoint folder to the Azure SQL database.
You need to resolve the error. The solution must provide the highest privacy possible.
Which privacy level should you select for each data source? To answer, select the appropriate options in the answer area.
NOTE: Each correct selection is worth one point.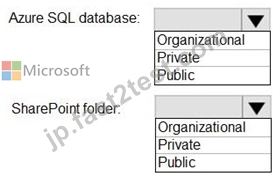
正解:
解説:
質問 # 100
You need to populate the CustomersWithProductScore table.
How should you complete the stored procedure? To answer, select the appropriate options in the answer area.
NOTE: Each correct selection is worth one point.
正解:
解説:
Topic 1, Litware, Inc. Overview
Litware, Inc. is a retail company that sells outdoor recreational goods and accessories. The company sells
goods both online and at its stores located in six countries.
Azure Resources
Litware has the following Azure resources:
* An Azure Synapse Analytics workspace named synapseworkspace1
* An Azure Data Lake Storage Gen2 account named datalake1 that is associated with synapseworkspace1
* A Synapse Analytics dedicated SQL pool named SQLDW
Dedicated SQL Pool
SQLDW contains a dimensional model that contains the following table.
SQLDW contains the following additional tables.
SQLDW contains a view named dbo.CustomerPurchases that creates a distinct list of values from
dbo.Customer [customeriD], dbo.Customer
[CustomerEmail], dbo.ProductfProductID] and dbo.Product[ProductName].
The sales data in SQLDW is updated every 30 minutes. Records in dbo.SalesTransactions are updated in
SQLDW up to three days after being created. The records do NOT change after three days.
Power BI
Litware has a new Power Bl tenant that contains an empty workspace named Sales Analytics.
All users have Power B1 Premium per user licenses.
IT data analysts are workspace administrators. The IT data analysts will create datasets and reports.
A single imported dataset will be created to support the company's sales analytics goals. The dataset will be
refreshed every 30 minutes.
Analytics Goals
Litware identifies the following analytics goals:
* Provide historical reporting of sales by product and channel over time.
* Allow sales managers to perform ad hoc sales reporting with minimal effort.
* Perform market basket analysis to understand which products are commonly purchased in the same
transaction.
* Identify which customers should receive promotional emails based on their likelihood of purchasing
promoted products.
Litware plans to monitor the adoption of Power Bl reports over time. The company wants custom Power Bl
usage reporting that includes the percent change of users that view reports in the Sales Analytics workspace
each month.
Security Requirements
Litware identifies the following security requirements for the analytics environment:
* All the users in the sales department and the marketing department must be able to see Power B1 reports that
contain market basket analysis and data about which customers are likely to purchase a product.
* Customer contact data in SQLDW and the Power B1 dataset must be labeled as Sensitive. Records must be
kept of any users that use the sensitive data.
* Sales associates must be prevented from seeing the CustomerEmail column in Power B1 reports.
* Sales managers must be prevented from modifying reports created by other users.
Development Process Requirements
Litware identifies the following development process requirements:
* SQLDW and datalake1 will act as the development environment. Once feature development is complete, all
entities in synapseworkspace1 will be promoted to a test workspace, and then to a production workspace.
* Power Bl content must be deployed to test and production by using deployment pipelines.
* All SQL scripts must be stored in Azure Repos.
The IT data analysts prefer to build Power Bl reports in Synapse Studio.
質問 # 101
......
Microsoft DP-500試験は、Microsoft AzureとMicrosoft Power BIを使用して企業規模の分析ソリューションを設計および実装する責任を持つ専門家の知識とスキルをテストするために設計されています。この試験は、データ分析、データモデリング、およびデータ可視化の経験がある個人、およびデータエンジニア、データアナリスト、およびビジネスインテリジェンス専門家と協力する個人を対象としています。
今すぐダウンロード!リアルMicrosoft DP-500試験問題集テストエンジン試験問題:https://jp.fast2test.com/DP-500-premium-file.html
検証済み!DP-500問題集と解答でDP-500テストエンジン正確解答付き:https://drive.google.com/open?id=1njUFlD9HKIGozaydmvGQylL2CkjoU083