

最新のDP-500合格保証付き試験問題集の認定サンプル問題
最新DP-500テスト材料には有効なDP-500テストエンジン
この試験は、Microsoft AzureとMicrosoft Power BIを使用して、エンタープライズスケール分析ソリューションの設計と実装の経験がある専門家のスキルをテストするように設計されています。この認定試験を受ける個人は、データを操作した経験があり、データ分析の概念を十分に理解することをお勧めします。
質問 # 51
You have a Power Bl report that contains one visual.
You need to provide users with the ability to change the visual type without affecting the view for other users.
What should you do?
- A. From Visual options in Report settings, select Use the modern visual header with updated styling options.
- B. From Tabular Editor, create a new perspective.
- C. From Report setting, select Personalize visuals.
- D. From the Bookmarks pane, select Focus mode, and then select Add.
正解:C
解説:
Explanation
Enable personalization in a report
You can enable the feature either in Power BI Desktop or the Power BI service. You can also enable it in embedded reports.
To enable the feature in Power BI Desktop, go to File > Options and settings > Options > Current file > Report settings. Make sure Personalize visuals is turned on.
質問 # 52
You have a Power Bi workspace named Workspacel in a Premium capacity. Workspacel contains a dataset.
During a scheduled refresh, you receive the following error message: "Unable to save the changes since the
new dataset size of 11,354 MB exceeds the limit of 10,240 MB."
You need to ensure that you can refresh the dataset.
What should you do?
- A. Connect Workspace1 to an Azure Data Lake Storage Gen2 account
- B. Turn on Large dataset storage format.
- C. Change License mode to Premium per user.
- D. Change the location of the Premium capacity.
正解:B
質問 # 53
After you answer a question in this section, you will NOT be able to return to it. As a result, these questions will not appear in the review screen.
You are using an Azure Synapse Analytics serverless SQL pool to query a collection of Apache Parquet files by using automatic schema inference. The files contain more than 40 million rows of UTF-8-encoded business names, survey names, and participant counts. The database is configured to use the default collation.
The queries use open row set and infer the schema shown in the following table.
You need to recommend changes to the queries to reduce I/O reads and tempdb usage.
Solution: You recommend defining an external table for the Parquet files and updating the query to use the table Does this meet the goal?
- A. Yes
- B. No
正解:B
質問 # 54
You have a Power Bl tenant that contains 10 workspaces.
You need to create dataflows in three of the workspaces. The solution must ensure that data engineers can
access the resulting data by using Azure Data Factory.
Which two actions should you perform? Each correct answer presents part of the solution.
NOTE: Each correct selection is worth one point
- A. Create and save the dataflows to the internal storage of Power BL
- B. Create and save the dataflows to an Azure Data Lake Storage account.
- C. Add the managed identity for Data Factory as a member of the workspaces.
- D. Associate the Power Bl tenant to an Azure Data Lake Storage account.
正解:C、D
質問 # 55
You need to recommend a security solution for the Power Bl tenant to control external data sharing. The solution must meet the technical requirements.
What should you recommend? To answer, select the appropriate options in the answer area.
NOTE: Each correct selection is worth one point.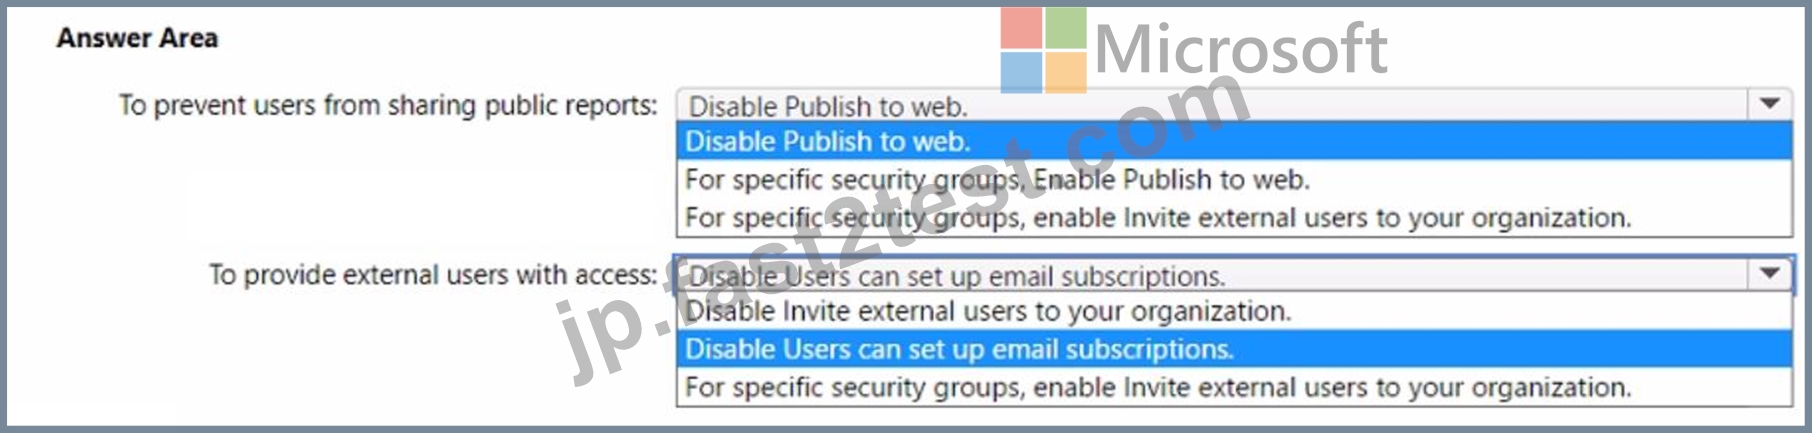
正解:
解説:
質問 # 56
Note: This question is part of a series of questions that present the same scenario. Each question in the series
contains a unique solution that might meet the stated goals. Some question sets might have more than one
correct solution, while others might not have a correct solution.
After you answer a question in this section, you will NOT be able to return to it. As a result, these questions
will not appear in the review screen.
You have a Power Bl dataset named Dataset1.
In Dataset1, you currently have 50 measures that use the same time intelligence logic.
You need to reduce the number of measures, while maintaining the current functionality.
Solution: From Power Bl Desktop, you create a hierarchy.
Does this meet the goal?
- A. Yes
- B. No
正解:B
質問 # 57
You have a dataset that contains a table named UserPermissions. UserPermissions contains the following data.
You plan to create a security role named User Security for the dataset. You need to filter the dataset based on
the current users. What should you include in the DAX expression?
- A. [User] = USEROBJECTID()
- B. [User] = USERNAMEQ()
- C. [UserPermissions] - USERPRINCIPALNAME()
- D. [UserPermissions] - USERNAME()
- E. [User] = USERPRINCIPALNAME()
正解:B
質問 # 58
You plan to create a Power Bl report that will use an OData feed as the data source. You will retrieve all the entities from two different collections by using the same service root The OData feed is still in development. The location of the feed will change once development is complete.
The report will be published before the OData feed development is complete.
You need to minimize development effort to change the data source once the location changes.
Which three actions should you perform in sequence? To answer, move the appropriate actions from the list of actions to the answer area and arrange them in the correct order.
正解:
解説:
Explanation
Graphical user interface, text, application Description automatically generated
Step 1: Create a parameter that contains the service root URI
Step 2: Get data from OData feed source and use the parameter to populate the first part of the URL.
The URI is in the first part of the query.
Example: let
Source = OData.Feed
("https://analytics.dev.azure.com/{organization}/{project}/_odata/v3.0-preview/WorkItemSnapshot? "
&"$apply=filter( "
&"WorkItemType eq 'Bug' "
&"and StateCategory ne 'Completed' "
&"and startswith(Area/AreaPath,'{areapath}') "
&"and DateValue ge {startdate} "
&") "
&"/groupby( "
&"(DateValue,State,WorkItemType,Priority,Severity,Area/AreaPath,Iteration/IterationPath,AreaSK), "
&"aggregate($count as Count) "
&") "
,null, [Implementation="2.0",OmitValues = ODataOmitValues.Nulls,ODataVersion = 4]) in Source Box 3: From Advanced Editor, duplicate the query and change the resource path in the URL.
Choose Get Data, and then Blank Query.
From the Power BI Query editor, choose Advanced Editor.
The Advanced Editor window opens.
Edit the query.
Etc.
Reference: https://docs.microsoft.com/en-us/azure/devops/report/powerbi/odataquery-connect
質問 # 59
You have a Power Bl dataset that contains the following measures:
* Budget
* Actuals
* Forecast
You create a report that contains 10 visuals.
You need provide users with the ability to use a slicer to switch between the measures in two visuals only.
You create a dedicated measure named cg Measure switch.
How should you complete the DAX expression for the Actuals measure? To answer, drag the appropriate values to the targets. Each value may be used once, more than once, or not at all. You may need to drag the split bar between panes or scroll to view content.
NOTE: Each correct selection is worth one point.
正解:
解説:
Reference:
https://docs.microsoft.com/en-us/dax/selectedvalue-function
質問 # 60
You open a Power Bl Desktop report that contains an imported data model and a single report page.
You open Performance analyzer, start recording, and refresh the visuals on the page. The recording produces the results shown in the following exhibit
What can you identify from the results?
- A. The Actual/Forecast Billable Hrs YTD visual displays the most data.
- B. The Actual/Forecast Hours by Type visual takes a long time to render on the report page when the data is cross-filtered.
- C. Unoptimized DAX queries cause the page to load slowly.
- D. When all the visuals refresh simultaneously, the visuals spend most of the time waiting on other processes to finish.
正解:D
解説:
Explanation
Most time is spent in the category Other - time required by the visual for preparing queries, waiting for other visuals to complete, or performing other background processing.
Note: Each visual's log information includes the time spent (duration) to complete the following categories of tasks:
DAX query - if a DAX query was required, this is the time between the visual sending the query, and for Analysis Services to return the results.
Visual display - time required for the visual to draw on the screen, including time required to retrieve any web images or geocoding.
Other - time required by the visual for preparing queries, waiting for other visuals to complete, or performing other background processing.
Reference: https://docs.microsoft.com/en-us/power-bi/create-reports/desktop-performance-analyzer
質問 # 61
You have five Power Bl reports that contain R script data sources and R visuals.
You need to publish the reports to the Power Bl service and configure a daily refresh of datasets.
What should you include in the solution?
- A. a workspace that connects to an Azure Data Lake Storage Gen2 account
- B. an on-premises data gateway (personal mode)
- C. a Power Bl Embedded capacity
- D. an on-premises data gateway (standard mode)
正解:B
質問 # 62
You need to configure a source control solution for Azure Synapse Analytics. The solution must meet the following requirements:
* Code must always be merged to the main branch before being published, and the main branch must be used for publishing resource
* The workspace templates must be stored in the publish branch.
* A branch named dev123 will be created to support the development of a new feature.
What should you do? To answer, select the appropriate options in the answer area.
NOTE: Each correct selection is worth one point.
正解:
解説:
質問 # 63
You have a Power Bl report that contains the table shown in the following exhibit.
The table contains conditional formatting that shows which stores are above, near, or below the monthly quota for returns. You need to ensure that the table is accessible to consumers of reports who have color vision deficiency. What should you do?
- A. Move the conditional formatting icons to a tooltip report.
- B. Add alt text to explain the information that each color conveys.
- C. Remove the icons and use red, yellow, and green background colors instead.
- D. Change the icons to use a different shape for each color.
正解:B
解説:
Explanation
Report accessibility checklist, All Visuals.
* Ensure alt text is added to all non-decorative visuals on the page.
* Avoid using color as the only means of conveying information. Use text or icons to supplement or replace the color.
* Check that your report page works for users with color vision deficiency.
* Etc.
Reference: https://docs.microsoft.com/en-us/power-bi/create-reports/desktop-accessibility-creating-reports
質問 # 64
What should you configure in the deployment pipeline?
- A. auto-binding
- B. a selective deployment
- C. a data source rule
- D. a backward deployment
正解:C
解説:
Explanation
Development Process Requirements
Litware identifies the following development process requirements:
SQLDW and datalake1 will act as the development environment. Once feature development is complete, all entities in synapseworkspace1 will be promoted to a test workspace, and then to a production workspace.
Power BI content must be deployed to test and production by using deployment pipelines.
Create deployment rules
When working in a deployment pipeline, different stages may have different configurations. For example, each stage can have different databases or different query parameters. The development stage might query sample data from the database, while the test and production stages query the entire database.
When you deploy content between pipeline stages, configuring deployment rules enables you to allow changes to content, while keeping some settings intact. For example, if you want a dataset in a production stage to point to a production database, you can define a rule for this. The rule is defined in the production stage, under the appropriate dataset. Once the rule is defined, content deployed from test to production, will inherit the value as defined in the deployment rule, and will always apply as long as the rule is unchanged and valid.
You can configure data source rules and parameter rules.
Incorrect:
Not B: if you already have a steady production environment, you can deploy it backward (to Test or Dev, based on your need) and set up the pipeline. The feature is not limited to any sequential orders.
Reference:
https://docs.microsoft.com/en-us/power-bi/create-reports/deployment-pipelines-get-started#step-4---create-deplo
質問 # 65
You need to build a Transact-SQL query to implement the planned changes for the internal users.
How should you complete the Transact-SQL query? To answer, select the appropriate options in the answer area.
NOTE: Each correct selection is worth one point.
正解:
解説:
Explanation
Box 1: PREDICT
Provide internal users with the ability to incorporate machine learning models loaded to the dedicated SQL pool.
The example below shows a sample query using prediction function. An additional column with name Score and data type float is created containing the prediction results. All the input data columns as well as output prediction columns are available to display with the select statement.
-- Query for ML predictions
SELECT d.*, p.Score
FROM PREDICT(MODEL = (SELECT Model FROM Models WHERE Id = 1),
DATA = dbo.mytable AS d, RUNTIME = ONNX) WITH (Score float) AS p;
Box 2: WITH
Reference:
https://docs.microsoft.com/en-us/azure/synapse-analytics/sql-data-warehouse/sql-data-warehouse-predict
質問 # 66
......
DP-500サンプルには正確な更新された問題がこちら:https://jp.fast2test.com/DP-500-premium-file.html
DP-500更新された試験問題集で[2024年最新] 練習には有効な試験問題集:https://drive.google.com/open?id=1njUFlD9HKIGozaydmvGQylL2CkjoU083