

最新(2024)NAHQ CPHQ試験問題集
最適な練習法にはNAHQ CPHQ試験の素晴らしいCPHQ試験問題PDF
CPHQ認定試験は、医療品質と患者安全の向上に献身している医療専門家にとって、必要不可欠な資格です。これは、卓越性へのコミットメントと、医療品質管理の追求において超越する意欲を示します。CPHQ認定を取得することで、医療専門家はキャリアを向上させ、収益性を高め、医療業界に意義ある影響を与えることができます。
CPHQ認定試験は、医療の品質管理における医療専門家の知識とスキルの厳密かつ包括的な評価です。この試験は、医療の質と患者の安全性に関する知識を現実世界のシナリオに適用する候補者の能力をテストするように設計されています。この認定は、ヘルスケア品質管理の卓越性のベンチマークとして認識されています。
質問 # 193
After discharge, most patients with a mental health diagnosis have not been compliant with follow-up visits.
Which of the following Is the best way to Improve patient compliance?
- A. Benchmark with other facilitiesinthe area to determine the rate of patient compliance.
- B. Initiate a process where the discharge planners call patients prior to the follow-up visit
- C. Communicate to noncompliant patients that appointments should be kept.
- D. Include handoutsinthe discharge documents on the Importance of keeping follow-up appointments.
正解:B
解説:
* According to the National Association for Healthcare Quality (NAHQ), one of the core competencies of healthcare quality professionals is patient safety, which includes ensuring effective transitions of care and reducing preventable readmissions12.
* One of the strategies to achieve this goal is to improve patient compliance with follow-up visits, which can help monitor patient outcomes, prevent complications, and provide continuity of care34.
* Among the four options given, the best way to improve patient compliance is to initiate a process where the discharge planners call patients prior to the follow-up visit. This is because:
* A phone call can serve as a reminder for the patient to keep the appointment, as well as an opportunity to address any barriers or concerns that the patient may have34.
* A phone call can also help establish rapport and trust between the patient and the discharge planner, which can increase patient satisfaction and adherence4.
* A phone call can also allow the discharge planner to confirm the patient's understanding of the discharge instructions, medication regimen, and follow-up plan, and to provide any additional education or support that the patient may need34.
* The other options are less effective because:
* Benchmarking with other facilities in the area to determine the rate of patient compliance may provide some insight into the current performance and best practices, but it does not directly address the specific needs and preferences of the individual patient5.
* Including handouts in the discharge documents on the importance of keeping follow-up appointments may increase the patient's awareness and knowledge, but it may not be sufficient to motivate the patient to act on the information, especially if the patient has low health literacy, cognitive impairment, or mental health issues.
* Communicating to noncompliant patients that appointments should be kept may sound authoritative and judgmental, which may alienate the patient and reduce their willingness to cooperate. Instead, a patient-centered and empathetic approach that acknowledges the patient's challenges and preferences may be more effective. References: 1: [NAHQ Code of Ethics] 2:
[NAHQ HQ Principles] 3: The Importance of Patient Follow-Up | MagMutual 4: The Importance of Patient Follow-Up and Service Recovery 5: [The Financial Case for Quality as a Business Strategy] : [Utilization of Improvement Methodologies by Healthcare Quality Professionals During the COVID-19 Pandemic] : [Understanding the Evolving Landscape of Healthcare Quality] : https://nahq.org/about-nahq/code-of-ethics/ : https://nahq.org/products/hq-principles/ :
https://nahq.org/resources/the-financial-case-for-quality-as-a-business-strategy-2/ :
https://nahq.org/resources/journal-for-healthcare-quality/utilization-of-improvement-methodologies-
1: https://nahq.org/news-media/news/understanding-the-evolving-landscape-of-healthcare-quality/
質問 # 194
The creation of an information technology infrastructure to analyze the performance of all physicians in a healthcare
system can be useful in:
- A. Clinical issues can be sorted out
- B. Identifying the disease the hospital, physician, or physical group treats most
- C. Physician report cards can be issued
- D. Organizations can develop clinical pathways
正解:B、D
質問 # 195
Basically an operational definition is a description in quantifiable terms, of what to measure and the specific steps needed to measure it constantly.
A good operational definition (Choose two):
- A. Is no doubt clear but somewhat ambiguous
- B. Gives communicable meaning to a concept or an idea
- C. Enables consistently in data collection
- D. Is a decision-making criteria
正解:B、C
質問 # 196
Which of the following quality Improvement Tools Is best for risk assessment of a new or modified process?
- A. failure mode and effects analysis (FMEA)
- B. 5 whys
- C. SWOT analysis
- D. force field analysis
正解:A
解説:
Failure Mode and Effects Analysis (FMEA) is a systematic method for evaluating a process to identify where and how it might fail, to assess the relative impact of different failures, and to identify the parts of the process that are most in need of change. FMEA includes review of the following: Steps in the process: Identify what could go wrong during each step.
Failure modes: Identify potential failure modes for each step.
Failure effects: For each failure mode, identify potential effects.
Severity: Assign a severity rating for each effect of failure.
Occurrence: Assign an occurrence rating for each failure mode.
Detection: Assign a detection rating for each failure mode and effect.
Risk Priority Number (RPN): Calculate the RPN for each effect.
FMEA is particularly useful in healthcare for risk assessment of a new or modified process because it not only identifies potential failures, but also prioritizes them based on their impact, frequency of occurrence, and detectability, allowing for targeted and efficient process improvement.
Reference: Quality improvement tools are standalone strategies or processes that can help you better understand, analyze, or communicate your QI efforts1. The 7 Basic Quality Tools for Process Improvement2.
A guide to quality improvement tools3.
質問 # 197
Which of the following tools provides the best way to display quarterly comparisons of patient satisfaction surveys?
- A. flowchart
- B. run chart
- C. fishbone diagram
- D. pie chart
正解:B
解説:
Comprehensive Step by Step Explanation:
A run chart is the best tool to display quarterly comparisons of patient satisfaction surveys. Here's why:
* Purpose of the Tools: Each of the tools mentioned in the options serves a different purpose.
* A fishbone diagram (also known as Ishikawa or cause and effect diagram) is used for root cause analysis. It helps identify, explore, and display the possible causes of a specific problem or quality characteristic1.
* A pie chart is a type of graph in which a circle is divided into sectors that each represent a proportion of the whole1. It's useful for showing simple proportional part-to-whole information, but it's not ideal for comparisons over time1.
* A flowchart is a type of diagram that represents a workflow or process, showing the steps as boxes of various kinds, and their order by connecting them with arrows1. This diagrammatic representation can give a step-by-step solution to a given problem.
* A run chart, on the other hand, is a graph that displays observed data in a time sequence1. It is an effective tool to use for displaying and analyzing the trend of data over time1.
* Why Run Chart: In the context of displaying quarterly comparisons of patient satisfaction surveys, a run chart is the most appropriate tool. It allows for the visualization of data trends over time, which is exactly what's needed when comparing patient satisfaction on a quarterly basis1. The x-axis represents time (in this case, quarters), and the y-axis represents the variable being measured (in this case, patient satisfaction). Each point on the chart represents a specific time period's data (a quarter's patient satisfaction survey results). The points are connected in the order of the time periods, creating a line that makes trends easy to spot1.
* Limitations of Other Tools: The other tools (fishbone diagram, pie chart, and flowchart) are not designed to display trends over time, which is crucial when comparing quarterly data1.
Therefore, based on the purpose of each tool and the need to display trends over time, a run chart is the best tool to display quarterly comparisons of patient satisfaction surveys.
質問 # 198
The healthcare quality professional has been asked to participate in the organizations population health program related to cost and utilization.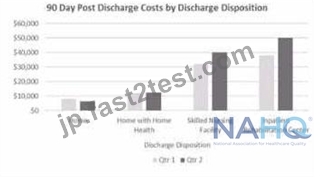
Based on this Information, what Is the next action the quality professional should take?
- A. Request Information on total number of patients discharged to each location for both quarters.
- B. Request Information on the cost per patient for those discharged to skilled nursing facilities.
- C. Analyze the appropriateness of discharges to Inpatient rehabilitation centers.
- D. Analyze the cost differences between patients discharged to home and skilled nursing facilities.
正解:A
解説:
To properly assess the cost and utilization patterns in the population health program, it is essential to understand the volume of patients being discharged to various post-acute care settings. By requesting the total number of patients discharged to each location, the healthcare quality professional can calculate the average cost per patient, which is crucial for assessing efficiency and for comparing costs across different discharge locations. This data will also allow for an evaluation of utilization patterns and help identify if certain locations are being used more frequently and if the associated costs are justified based on patient outcomes.
Reference: The response aligns with healthcare quality improvement practices that prioritize a comprehensive understanding of patient flow and associated costs, as recommended by the NAHQ. This includes analysis of patient discharge patterns and post-discharge care utilization as foundational data for assessing quality and cost in healthcare delivery.
質問 # 199
In every survey, some people agree to be respondents but do not answer every question. Although non-response to
individual questions is usually low, occasionally it can be high and can affect estimates. Categories of patients
mentioned below selected to be in the sample; do not actually provide data. Which of the following is odd one?
- A. Patients asked to provide data who are unable to perform the task required of them (e.g., people who are too ill to
respond to a survey or whose reading and writing skills preclude them from filling out self-administered
questionnaires) - B. Patients do not truly provide demographic information
- C. Patients asked to provide data who refuse to do so (do not respond to the survey)
- D. Patients the data collection procedures do not reach, thereby not giving them a chance to answer questions
正解:B
質問 # 200
The strategic plan for an organization calls for expansion of information technology. The following information is available:
If equal weight is given to each consideration, which of the following options should be the primary choice?
- A. Option A
- B. Option C
- C. Option B
- D. Option D
正解:B
解説:
If equal weight is given to each consideration (Benefits, Implementation Changes, and Cost), Option C should be the primary choice. The rationale is as follows:
* Benefits: While Option A has the highest benefit score (8), Option C's benefit score of 5 is still relatively strong.
* Implementation Changes: Option C has the fewest implementation changes ("x"), suggesting it will be easier to implement.
* Cost: Option C is the second most cost-effective option ("$$"), balancing cost against benefits and implementation changes.
Option C strikes a balance between benefits, ease of implementation, and cost, making it a solid choice when all factors are weighted equally.
* Option A (A): Although it offers the highest benefits, it also has the highest cost ("$$$$") and the most implementation changes ("xxxx").
* Option B (B): This option has slightly lower benefits, moderate implementation changes, and high cost ("$$$").
* Option D (D): Although it has the lowest cost, the benefits are also the lowest, making it less attractive overall.
References
* NAHQ Body of Knowledge: Strategic Decision-Making in IT Initiatives
* NAHQ CPHQ Exam Preparation Materials: Cost-Benefit Analysis in Healthcare Projects
質問 # 201
Health plan databases are an excellent source of data for quality improvement projects particular projects that have _______________.
For many years, health plans have used a variety of means to collect data on their performance, track the management of care received by their numbers and direct program in disease management and care management.
- A. Baseline assessment
- B. Sophisticated data warehouses
- C. A population health management focus
- D. Full engagement at nursing unit
正解:C
質問 # 202
Identification of quality Improvement opportunities can best be Identified through
- A. organizational strategic goals.
- B. payor requirements.
- C. suggestions for new legal statutes.
- D. patient complaints.
正解:D
解説:
Patient complaints are a direct reflection of patient experience and can provide specific, actionable insights into areas needing improvement. Unlike payor requirements and legal statutes which are external mandates, or organizational strategic goals which are broad and may not capture immediate patient concerns, patient complaints can highlight specific, often overlooked areas in the patient's care experience. By addressing the issues raised in complaints, a healthcare organization can make targeted improvements that directly enhance patient satisfaction and care quality.
References:NAHQ's resources suggest that patient feedback is a critical component of quality improvement.
This aligns with the principles of the Patient-Centered Care domain in the NAHQ Healthcare Quality Competency Framework, which highlights the importance of respecting patients' values and preferences and using patient feedback to drive improvements.
質問 # 203
Licensing and accrediting bodies have relied heavily on structural measures of quality not only because the measures are relatively stable and thus easier to capture but:
- A. They reliably identify providers who are cheap
- B. They can never la the means to deliver high quality care
- C. They reliably identify physicians
- D. They reliably identify providers who demonstrably la means to deliver high quality care
正解:D
質問 # 204
An organization notices an Increase In medication errors In three patient care areas.
Which of the following concepts will be most effective when Improving medication administration workflows?
- A. elimination of wait time from the pharmacy
- B. delivery of medications in batches each shift
- C. design of mistake-proof systems
- D. Improvement of staff training on safe medication practices
正解:C
解説:
The most effective concept when improving medication administration workflows in the context of increased medication errors would be the design of mistake-proof systems1234.
Understanding the Problem: The first step is to understand the problem, which in this case is an increase in medication errors in three patient care areas1.
Standardizing and Safeguarding Medication Administration: Standardizing and safeguarding medication administration is a key strategy in reducing medication errors1. This involves confirming medication details using tools like the rights of medication administration or "read back" strategies1. Designing Mistake-Proof Systems: Mistake-proofing the system involves the use of technology such as bar-coding systems and electronic medication administration records2. These technologies have been shown to improve medication administration safety4. However, it's important to implement these technologies carefully to avoid unintended consequences2.
Continuous Improvement: After implementing the changes, it's important to evaluate the effectiveness of the solutions. This can be done using Plan-Do-Study-Act (PDSA) cycles3. In these cycles, small tests of change are planned, implemented on a small scale, performance-measured compared to the current state, and changed to adjust the process3.
By designing mistake-proof systems, the organization can significantly reduce the risk of medication errors, thereby improving patient safety and care quality.
質問 # 205
Payers are more likely to embrace the optimization definition of care which can put them at odds with:
- A. Clinicians
- B. Health administrators
- C. Physicians
- D. Both A & B
正解:C
質問 # 206
Benchmarking is goal directed and promotes performance improvement by all of the following ways EXCEPT:
- A. Substantiating the need for improvement
- B. Creating objective measures of performance that are driven by industry leading targets instead of by past performance
- C. Providing a customer internal focus
- D. Providing an environment amenable to organizational change through continuous improvement and striving to match industry-leading practices and results
正解:A
質問 # 207
A quality Improvement team has Identified specific changes to Implement for a quality Improvement Initiative. As the next step, the team would like to establish a concrete timeline for implementation.
Which of the following is the best tool to use for this step?
- A. Ishikawa diagram
- B. process map
- C. Gantt chart
- D. bar graph
正解:C
解説:
A process map is a tool that shows the sequence of steps or activities involved in a process, and identifies the inputs, outputs, and decision points. It can help to identify waste, variation, and inefficiencies in a process, and to design or redesign a process for improvement. However, it does not show the time required or allocated for each step or activity, nor the dependencies or interrelationships among them. Therefore, it is not the best tool to use for establishing a timeline for implementation.
A Gantt chart is a tool that shows the tasks or phases of a project, the duration and order of each task or phase, the milestones or deliverables, and the progress or status of each task or phase. It can help to plan and schedule a project, to monitor and communicate its progress, to identify critical tasks or phases, and to allocate resources and responsibilities. Therefore, it is the best tool to use for establishing a timeline for implementation.
An Ishikawa diagram (also known as a fishbone diagram or a cause-and-effect diagram) is a tool that shows the possible causes of a problem or an effect, and organizes them into categories or branches. It can help to identify the root causes of a problem, to brainstorm potential solutions, and to prioritize areas for improvement. However, it does not show the time or sequence of the causes or solutions, nor the tasks or phases of a project. Therefore, it is not the best tool to use for establishing a timeline for implementation.
A bar graph (also known as a histogram or a column chart) is a tool that shows the frequency or distribution of data in different categories or groups, using vertical or horizontal bars. It can help to compare data across categories or groups, to identify patterns or trends, and to display numerical information visually. However, it does not show the time or sequence of the data, nor the tasks or phases of a project. Therefore, it is not the best tool to use for establishing a timeline for implementation.
Reference: Gantt Chart | Digital Healthcare Research
Gantt Chart | Turas | Learn
Chart Template - Gantt Chart - Health Quality Council
Project Planning - Institute for Healthcare Quality Improvement
Best examples of timelines, Gantt charts, and roadmaps for the healthcare sector [HQ Principles | NAHQ]
質問 # 208
Sampling is a key that healthcare professionals need to develop. If a process does not generate a lot of data, you probably will analyze all the occurrences of an event and not need to consider sampling.
Sampling usually is not required when the measure is:
- A. A rate
- B. A strata
- C. A percentage
- D. A step by step process
正解:D
質問 # 209
......
ヘルスケア品質の専門家向けの Certified Professional in Healthcare Quality (CPHQ) 試験は、世界的に認められた資格です。この試験は、ヘルスケア品質を教育、認定、ネットワーキングの機会を通じて促進する専門組織である National Association for Healthcare Quality (NAHQ) によって実施されます。CPHQ 認定は、ヘルスケアのプロフェッショナルが品質管理、患者安全、パフォーマンス改善における専門知識を持っていることを証明します。
更新された検証済みの合格させるCPHQリアル試験問題と解答:https://jp.fast2test.com/CPHQ-premium-file.html
問題集返金保証付きのCPHQ問題集公式問題集:https://drive.google.com/open?id=1CJtjaShV1MiiNwjKUxaGo7Olu9R8D1h0