

100%の合格率を試そう!更新されたのはTDA-C01日本語試験問題 [2024]
合格させるTDA-C01日本語試験にはリアル問題解答
質問 # 16
図書館の本に関するデータを含む Mowing の 2 つのテーブルがあります。

両方の表が不完全であるため、表から欠落している本があります。
テーブルを組み合わせる必要があります。ソリューションでは、すべてのデータが確実に保持されるようにする必要があります。どのタイプの結合を使用する必要がありますか?
- A. 完全外部結合
- B. 左結合
- C. 右結合
- D. 内部結合
正解:A
解説:
To combine the two tables that contain data about books in a library and ensure that all the data is retained, you should use a full outer join. A full outer join is a type of join that returns all rows from both tables, regardless of whether there is a match or not. If there is no match, null values are filled in for the missing fields.
To perform a full outer join, you need to do the following steps:
Connect to both tables as your data sources in Tableau. You can use either live or extract connections.
Drag one table to the canvas and drop it on top of another table. This will create a join between them based on a common field.
Click on the join icon between the tables and select Full Outer Join from the drop-down list. This will change the join type to full outer join and show all rows from both tables.
Optionally, you can add or remove join clauses by clicking on Add or Remove buttons next to each clause. You can also change or rename fields by clicking on them.
The other types of joins are not correct for this scenario. An inner join returns only the rows that have a match in both tables, which will exclude any books that are missing from either table. A left join returns all rows from the left table and only the matching rows from the right table, which will exclude any books that are only in the right table. A right join returns all rows from the right table and only the matching rows from the left table, which will exclude any books that are only in the left table. Reference: https://help.tableau.com/current/pro/desktop/en-us/joining_tables.htm https://help.tableau.com/current/pro/desktop/en-us/join_types.htm
質問 # 17
さまざまな日付からの売上の累積を示す次のグラフがあります。
次の図に示すように月を表示する必要があります。
あなたは何をするべきか?
- A. 日付を正確な日付に変換します
- B. データのミスティング値を表示を選択します
- C. 日付を属性に変換
- D. 日付を連続に変換
正解:D
質問 # 18
次の 2 つのデータセットがあります。
* Employee Name と Department という名前の 2 つの列がある Microsoft Excel ワークシート
* Employee Name という名前の列が 3 つある Microsoft SQL Server テーブル。等級とチームサイズを支払う。
Tableau Prep を使用して 2 つのデータセットを結合したいと考えています。
次のうち、どの 3 つのアクションを実行する必要がありますか? (正しい選択肢を 3 つ並べてください。)
正解:
解説: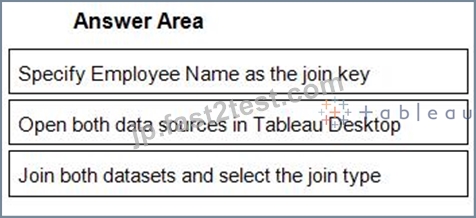
1 - Specify Employee Name as the join key
2 - Open both data sources in Tableau Desktop
3 - Join both datasets and select the join type
質問 # 19
2017 年から現在までのビジネス セグメントごとの毎日の売上を含むデータセットがあります 月次の履歴トレンドを使用して、将来のセグメントごとの売上を予測したい 注文時に実行する必要がある 3 つのアクションはどれですか?
(3 つの正しい選択肢を順番に配置するには、矢印を使用して選択肢を回答エリア I 回答エリア内に移動し、選択肢を並べ替えます。)
正解:
解説:
1 - Aggregate the date to month and year
2 - Create a calculated field that uses the MODEL_QUANTILE function.
3 - Add the date to the Columns shelf Add the segment and the sales to the Rows shelf
質問 # 20
次のデータセットがあります。
Tableau_User_Name フィールドに基づいて、特定の Tableau ユーザーに関連するデータのみを表示するようにフィルター処理されるダッシュボードを作成することを計画している データ ソースに配置するブール演算フィールドを作成して、より細かくフィルターに使用する式を作成する必要がある?
- A. ISFULLNAMETableu_USER_NAME))=USERNAME()
- B. USERNAME()=(Tableau_USER_NAME)
- C. NAMEUSERNAME()
- D. NAME Tableau-USER-NAME)
正解:B
解説:
To create a boolean calculated field to place on the data source filter, you should use the formula USERNAME() = [Tableau_user]. This formula will return TRUE if the current Tableau user name matches the value in the Tableau_user field, and FALSE otherwise. You can use this formula as a data source filter by dragging it to the Filters shelf and selecting TRUE from the menu. This will filter the data to show only the rows that are relevant to the specific Tableau user.
The other options are not correct for this scenario. NAME([Tableau_user]) is not a valid function in Tableau. ISFULLNAME([Tableau_user]) = USERNAME() is not a valid expression in Tableau. 'S' + STR([Sales]/1000) is not a boolean expression, but a string expression that converts sales to thousands with a prefix of "S". Reference: https://help.tableau.com/current/pro/desktop/en-us/filtering_datasource.htm https://help.tableau.com/current/pro/desktop/en-us/functions_functions_logical.htm#USERNAME https://help.tableau.com/current/pro/desktop/en-us/calculations_calculatedfields.htm
質問 # 21
Microsoft SQL Server データベースに接続しました
ベルリン市の学生のみの学生が返される必要があるという名前のテーブルから行を取得するカスタム SQL クエリを作成する必要があります。クエリをどのように完了する必要がありますか? (適切なオプションを回答領域にドラッグし、正しい場所にドロップします。)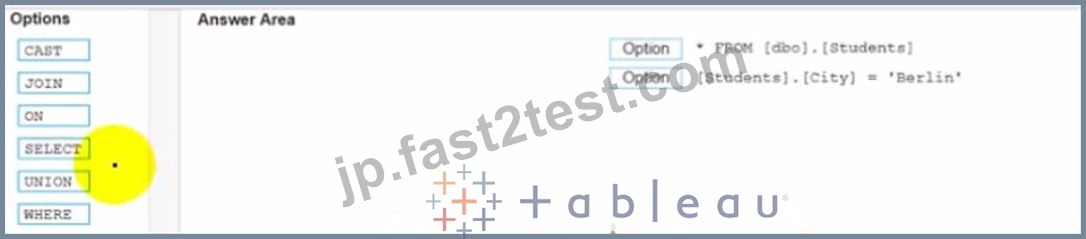
正解:
解説:
質問 # 22
あなたの会社には、米国とドイツに 2 つの部門があり、バッハ部門には別のデータベースがあります。以下は、米国における部門の売上データのサンプルです。
以下は、ドイツの me 部門の売上データのサンプルです。
Populatio.csv という名前のファイルに人口データがあります。以下はデータのサンプルです。
各営業担当者の 1 人あたりのタイ売上を ml で表示するビジュアライゼーションを作成する予定です。各営業担当者は、フルネームで識別される必要があります。
計画された視覚化をサポートするデータを準備する必要があります。データ ソースはパブリッシュをサポートしている必要があります。
どの 4 つのアクションを順番に実行する必要がありますか?
(4 つの正しい選択肢を順番に配置します。矢印を使用して選択肢を回答エリアの矢印に移動し、選択肢を並べ替えます。
オプションを並べ替えるには、回答エリアの矢印を使用します)
正解:
解説:
1 - Open Tableau Desktop
2 - Create a new column to Concatenate the name for the Germany division.
3 - Union the sales data of both divisions.
4 - Join the sales data and the population data by using City as the join field.
質問 # 23
sales、City、および Region という名前のフィールドを含むデータベースがあります。
さまざまな都市での販売数を示す次のグラフがあります。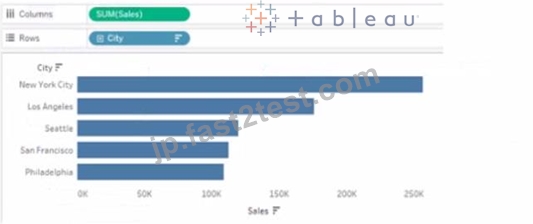
ユーザーがいずれかの棒の上にマウスを置いたときに、対応する領域を動的に表示したいとします。
あなたは何をするべきか?
- A. City のエイリアスを編集します。
- B. [領域] を [マーク] カードのツールヒントにドラッグします。
- C. グラフのバーを右クリックし、[ラベルをマーク] を選択してから、[常に表示] を選択します。
- D. チャットで a を右クリックし、[注釈] を選択してから [マーク] を選択します。
正解:B
解説:
To show the corresponding region when users hover their mouse over any of the bars, you need to drag Region to Tooltip on the Marks card. This will add Region as a field in the tooltip text that appears when users hover over a mark. You can also customize the tooltip text by editing it in the Tooltip dialog box. Reference: https://help.tableau.com/current/pro/desktop/en-us/buildmanual_shelves.htm https://help.tableau.com/current/pro/desktop/en-us/formatting_tooltips.htm
質問 # 24
次の地図があります。
次のビジュアライゼーションに示すようにマップが表示される必要があります。
あなたは何をするべきか?
- A. マークの種類をマップに変更します。
- B. マーク カードの位置をサイズにドラッグします。
- C. マークの種類を濃度に変更します。
- D. [マーク] カードの [サイズ] まで人口をドラッグします。
- E. 不透明度を75%に変更します
正解:D
質問 # 25
デスクトップにある Book1 へのリンクを開きます。ヒストグラム ワークシートを開き、Superstone データ ソースを使用します。
3 のビン サイズを使用して、Quantity フィールドのヒストグラムを作成します。
- A. フィードバックをお送りください。
- B. をお送りください
正解:A
質問 # 26
Category という名前の 4 つのフィールドを持つデータセットがあります。利益率と顧客名。次のビジュアライゼーションを作成する必要があります。

正解:
解説: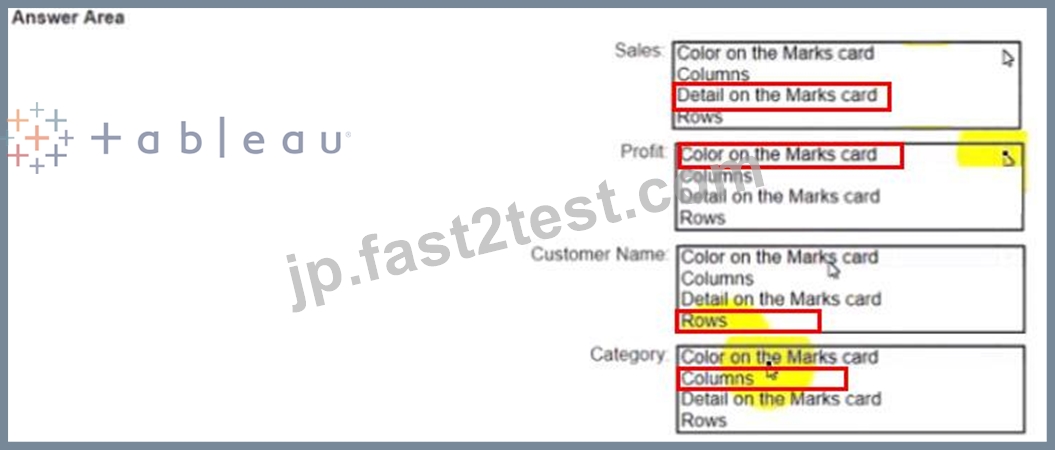
質問 # 27
Choose Region という名前のパラメーターを作成すると、Region という名前のフィールドからの値が含まれます。
ユーザーが [地域の選択] パラメーターを使用して、異なる地域間でログを記録することにより、チャートを操作できるようにしたい 次に何をすべきか?
- A. Choose Region パラメータを Single Value (リスト) に設定します。
- B. [Region] = [choose Region) 式をフィルター カードに追加します。
- C. Region を me Fitters カードに追加します
- D. [地域の選択] パラメーターを [ページ] カードに追加します。
正解:C
質問 # 28
次のボックス プロットは、すべての州の地域別の平均利益の分布を示しています。
利益の分布が最も小さいのはどの地域ですか?
- A. 中央
- B. ウエスト
- C. 南
- D. キャスト
正解:A
解説:
The central region has the smallest distribution of profits because it has the smallest interquartile range (IQR), which is the distance between the first and third quartiles of the box plot. The IQR measures the spread of the middle 50% of the data. The smaller the IQR, the less variation in the data. Reference: https://help.tableau.com/current/pro/desktop/en-us/buildexamples_boxplot.htm https://www.statisticshowto.com/probability-and-statistics/interquartile-range/
質問 # 29
2 軸グラフを持つビジュアライゼーションを作成する予定です。2 軸グラフには形状グラフが含まれ、折れ線グラフでは、軸に人口という名前の同じメジャーが使用されます。
線よりもはるかに大きくなるように形状を構成する必要があります。
あなたは何をするべきか?
- A. 人口を個別の次元に変更します
- B. デフォルトの形状よりも大きいカスタム形状を作成し、その形状をマイ リポジトリの Shapes フォルダーに追加します。
- C. 2 番目の軸については、[マーク] カードで [形状] を選択します。[形状パレットの選択] から [カスタム] を選択し、[リセット] を選択します。
- D. 人口の複製 複製を 2 番目のマーク カードにドラッグし、マークの表示を個別に構成します。
正解:D
解説:
To configure the shapes to be much larger than the line, you need to duplicate Population and drag it to the second Marks card. This will create a dual axis chart with two measures on one axis. You can then select Shape on one Marks card and Line on another Marks card, and adjust the size of each mark independently using the Size slider or menu. Reference: https://help.tableau.com/current/pro/desktop/en-us/multiplemeasures_dualaxes.htm https://help.tableau.com/current/pro/desktop/en-us/marks_markproperties_size.htm
質問 # 30
次のビジュアライゼーションがあります。

正解:
解説:
質問 # 31
sates データを含むデータセットがあります
を。以下はデータのサンプルです。
月の売り上げが $50 000 を超える場合は、true の値を返す必要があります。それ以外の場合、式は false の値を返す必要があります。
目標を達成する式はどれか 2 つ選択してください
- A. SUM{[Sales]) IN (50000)
- B. [Sales] > 50000
- C. MAX< [Sales], 50000)
- D. IIF(SUM< [Sales] )>50000, TRUE, FALSE)
正解:B、D
質問 # 32
デスクトップにある Book1 へのリンクを開きます。Movie Duration ワークシートを開きます。
既存のデータ ソースを Netflix_2019 データ ソースに置き換えます。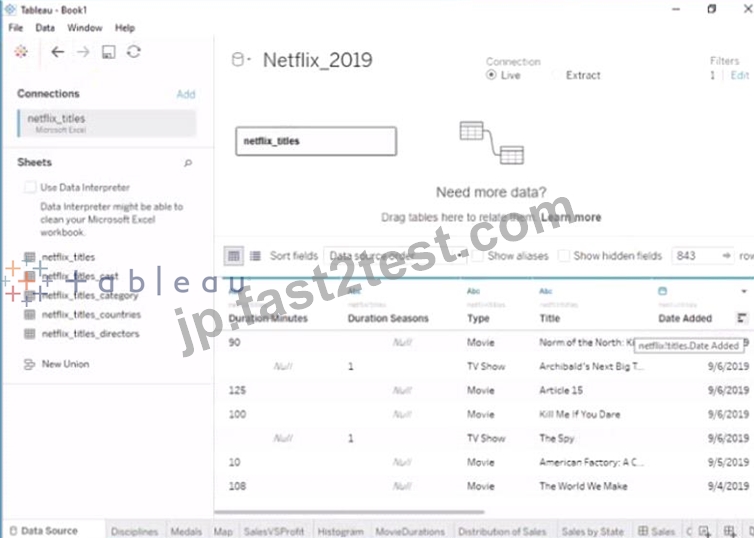
正解:
解説:
Send us your feedback on it
質問 # 33
次のデータセットがあります。
Tableau_User_Name フィールドに基づいて、特定の Tableau ユーザーに関連するデータのみを表示するようにフィルター処理されるダッシュボードを作成することを計画している データ ソースに配置するブール演算フィールドを作成して、より細かくフィルターに使用する式を作成する必要がある?
- A. ISFULLNAMETableu_USER_NAME))=USERNAME()
- B. NAMEUSERNAME()
- C. USERNAME()=(Tableau_USER_NAME)
- D. NAME Tableau-USER-NAME)
正解:D
質問 # 34
患者の健康に関する機密情報を含むダッシュボードがあります。医療従事者のチームにとって、データは常に最新の状態である必要があります ダッシュボードを医療従事者とどのように共有すればよいですか?
- A. ダッシュボードを .twbx としてエクスポートします
- B. ダッシュボードを Tableau Public に発行する
- C. ダッシュボードを Tableau Server にパブリッシュする
- D. ダッシュボードを PDF に印刷
正解:C
解説:
To share a dashboard that contains confidential information about patients health and needs to always be up to date for a team of healthcare workers, you should publish it to Tableau Server. This will allow you to control who can access and interact with your dashboard, as well as schedule automatic refreshes of your data source or extract. Publishing to Tableau Public would expose your data to anyone on the internet, printing to PDF would not update your data, and exporting as a .twbx would require sending a large file that might not be compatible with other versions of Tableau. Reference: https://help.tableau.com/current/pro/desktop/en-us/publish_workbooks_share.htm https://help.tableau.com/current/pro/desktop/en-us/publish_workbooks_tableauserver.htm
質問 # 35
次のようなビジュアライゼーションが得られます。
RANK(AVG([スコア]) という式を持つ Rank_Score という名前の表計算を作成し、Rank_Score をマーク カードのテキストにドラッグします。
学生 ID 4220 のランク スコア値は何ですか?
- A. 0
- B. 1
- C. 2
- D. 3
正解:A
解説:
the rank function returns the rank of each row within the partition of a result set. The rank of a row is one plus the number of ranks that come before the row in question.
To answer your question, we need to apply the rank function to the Avg Score column and sort it in descending order. Then we can find the rank score value for Student ID 4220 by looking at the corresponding row.
Here is how the table would look like after applying the rank function and sorting:
As you can see, the rank score value for Student ID 4220 is 1.
質問 # 36
あなたの会社には、米国とドイツに 2 つの部門があり、バッハ部門には別のデータベースがあります。以下は、米国における部門の売上データのサンプルです。
以下は、ドイツの me 部門の売上データのサンプルです。
Populatio.csv という名前のファイルに人口データがあります。以下はデータのサンプルです。
各営業担当者の 1 人あたりのタイ売上を ml で表示するビジュアライゼーションを作成する予定です。各営業担当者は、フルネームで識別される必要があります。
計画された視覚化をサポートするデータを準備する必要があります。データ ソースはパブリッシュをサポートしている必要があります。
どの 4 つのアクションを順番に実行する必要がありますか?
(4 つの正しい選択肢を順番に配置します。矢印を使用して選択肢を回答エリアの矢印に移動し、選択肢を並べ替えます。
オプションを並べ替えるには、回答エリアの矢印を使用します)
正解:
解説:
1 - Open Tableau Desktop
2 - Create a new column to concatenate the name for the Germany division.
3 - Union the sales data of both divisions.
4 - Join the sales data and the population data by using City as the join field
質問 # 37
次のデータセットがあります。
[ランク] フィールドに表示されるランキングを計算する必要があります。
式をどのように完成させる必要がありますか? (回答エリアのドロップダウンを使用して正しいオプションを選択し、式を完成させますか?
正解:
解説:
質問 # 38
図書館の本に関するデータを含む Mowing の 2 つのテーブルがあります。

両方の表が不完全であるため、表から欠落している本があります。
テーブルを組み合わせる必要があります。ソリューションでは、すべてのデータが確実に保持されるようにする必要があります。どのタイプの結合を使用する必要がありますか?
- A. 左結合
- B. 内部結合
- C. 右結合
- D. 完全外部結合
正解:B
質問 # 39
Sheet1 Sheet2 および Sheet3 という名前の 3 つのワークシートを含む Tableau ワークブックがあります。
いくつかのフィルタを作成します。
[データ ソース] ページから、データ ソース フィラーを追加する予定です
[データ ソース フィルターの編集] ダイアログ ボックスにフィルターの種類が表示されるのはいつですか?
- A. シート 1 とシート 2 のディメンションの上位 N 条件ファイラー
- B. シートで使用される表計算フィルター
- C. 全シートに次元マウ
- D. ディメンション m Sheet3 のコンテキスト フィラー
正解:A
質問 # 40
......
TDA-C01日本語試験問題を最新版を今すぐ試そうの[2024年最新] 正解回答付き:https://jp.fast2test.com/TDA-C01-JPN-premium-file.html