

[2024年12月]更新のTableau TDA-C01日本語問題集とリアルな試験問題
2024年最新のTDA-C01日本語のPDF最近更新された問題
質問 # 40
デスクトップにある Book1 へのリンクを開きます。ヒストグラム ワークシートを開き、Superstone データ ソースを使用します。
3 のビン サイズを使用して、Quantity フィールドのヒストグラムを作成します。
正解:
解説:
Send us your feedback on it
質問 # 41
ワークシートに折れ線グラフがあります。
次の視覚化に示すように、2020 年 3 月にコメントを追加します。
あなたは何をするべきか?
- A. 成長率を [マーク] カードの [テキスト] にドラッグします
- B. ツールチップを追加
- C. キャプションを有効にする
- D. 2020 年 3 月に注釈を付ける
正解:D
解説:
To add a comment to March 2020 on a line chart, you need to annotate that mark. You can right-click on the mark and select Annotate > Mark from the menu. This will open a dialog box where you can type your comment and format it as you like. You can also drag and drop the annotation to position it on the worksheet. Dragging the growth rate to Text on the Marks card will add a label to every mark on the line chart, enabling captions will show a description of the worksheet at the bottom, and adding a tooltip will show a text box when users hover over a mark. Reference: https://help.tableau.com/current/pro/desktop/en-us/formatting_annotations.htm https://help.tableau.com/current/pro/desktop/en-us/formatting_annotations_create.htm
質問 # 42
デスクトップにある Book1 へのリンクを開きます。分野ワークシートを開きます。
テーブルをフィルタリングして、獲得したメダルの数に基づいてトップ 10 の NOC を表示します。
正解:
解説:
Send us your feedback on it
質問 # 43
Dorm_Code という名前のディメンションを含む次のプライマリ データ ソースがあります。
更新された寮コードを含む次のセカンダリ データ ソースを受け取ります。
更新された寮コードを Tableau に取り込み、そのコードを既存のビジュアライゼーションで使用する必要があります。新しい寮コードでは、既存のフィールド名 Dorm_Code を使用する必要があります。
あなたは何をするべきか?
- A. リレーションシップを使用してセカンダリ データ ソースを取り込みます。[データ] ペインで、[Dorm_Name] を右クリックし、[参照の置換] を選択して、[Dorm_Name_New] を選択します。
- B. セカンダリ データ ソースをユニオンとして取り込みます。
- C. セカンダリ テーブルをプライマリ データ ソースへの左結合として取り込みます。[データ ソース] ページから、[Dorm_Name] フィールドで [計算フィールドの作成] を選択し、計算ウィンドウに [Dcrm_Name_New] と入力します。
- D. データ ブレンドを作成し、[プライマリ エイリアスの編集] を選択して、プライマリ データ ソースのエイリアス値をセカンダリ データ ソースの値に置き換えます。
正解:A
解説:
Using relationships: You can use relationships to link the secondary data source with the primary data source based on a common field. This will allow you to use fields from both data sources in your visualization without creating new fields or duplicating data. You can then replace references to update the dimension values. For example, you can use relationships to link the updated dorm codes with the primary data source and then replace Dorm_Code with Dorm_Code_New in your visualization.
https://community.tableau.com/s/question/0D54T00000C5ldZSAR/update-data-view-based-on-dimension
質問 # 44
毎日メールを受信トレイに配信するビューを購読します。
他の関係者がサブスクリプションを利用できるようにしたいと考えています。
あなたは何をするべきか?
- A. ダッシュボードの概要ページから、サブスクリプションを変更します。
- B. [マイ コンテンツ] 概要ページから、アラートを変更します。
- C. ワークシートからサブスクリプションを変更します。
- D. [マイ コンテンツ] 概要ページから、サブスクリプションを変更します。
正解:D
質問 # 45
ダッシュボード上のバーをクリックすると、「詳細についてはここをクリックしてください!」というリンクを含むツールヒントが表示されるようにしたいと考えています。次の展示品に示されているように。

正解:
解説:
質問 # 46
次のデータセットがあります。
[ランク] フィールドに表示されるランキングを計算する必要があります。
式をどのように完成させる必要がありますか? (回答エリアのドロップダウンを使用して正しいオプションを選択し、式を完成させますか?
正解:
解説:
質問 # 47
あなたはいくつかのビューを購読しています。
ビューの購読を解除する必要があります。
何を使えばいいのでしょうか?
- A. Tableau Prep の通知領域
- B. Tableau Web ページの [マイ コンテンツ] 領域
- C. 「自分と共有」ページ
- D. Tableau Desktop のデータ ソース ページ
正解:B
解説:
To unsubscribe from the views, you should use the My Content area of Tableau web pages. This area allows you to manage your subscriptions, as well as your workbooks, views, and data sources. You can select the views you want to unsubscribe from, click Actions, and then click Unsubscribe. You can also change the subscription options, such as the schedule, the format, or the message. References:
Create a Subscription to a View or Workbook - Tableau
Tableau Certified Data Analyst Study Guide
質問 # 48
次のような 1 つのシートを持つタイル状のダッシュボードがあります。
シートを Sheet2 に置き換えたいとします。
あなたは何をするべきか?
- A. Sheet3 のコンテキスト メニューから、[ダッシュボード項目の削除] を選択します。
- B. Sheet2 を右クリックし、[ダッシュボードに追加] を選択します。
- C. Sheet2 をダッシュボードにドラッグします。
- D. Sheet3 を選択し、Sheet2 の横にある [シートの交換] ボタンをクリックします。
- E. Sheet3 のコンテキスト メニューから [選択解除] を選択します。
正解:C
解説:
In Tableau, to replace a sheet on a dashboard, you can simply drag the desired sheet (Sheet2 in this case) from the sheets list onto the dashboard where the current sheet (Sheet3) is. This will replace the existing visualization with the new one.
質問 # 49
次の列を含むデータ ソースがあります。
最も高い売上に基づいて地域をフィルタリングしたいと考えています。ユーザーは、表示される領域の数を指定できる必要があります。
どの 3 つのアクションを順番に実行する必要がありますか? (正しい 3 つの選択肢を順番に並べてください。矢印を使用して選択肢を回答エリアに移動します。
選択肢を並べ替えるには、回答領域の矢印を使用します)。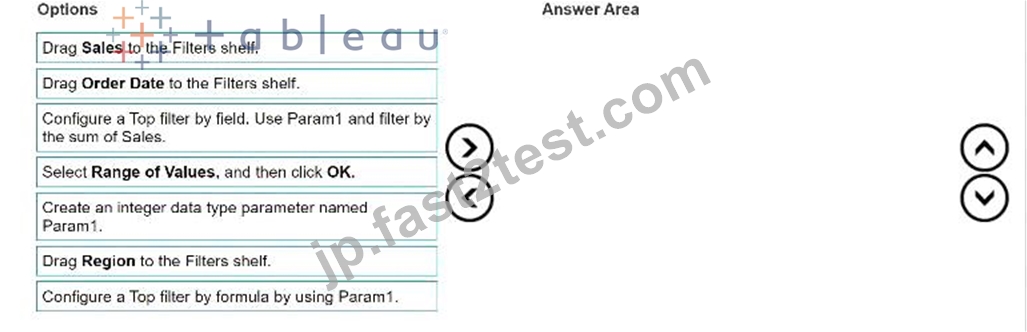
正解:
解説:
Explanation:
To filter regions based on the highest sales and allow users to specify the number of regions shown, you should perform these actions in order:
Answer area:
Create an integer data type parameter named Param1.
Drag Region to the Filters shelf.
Configure a Top filter by field. Use Param1 and filter by the sum of Sales.
To create a dynamic filter that lets users choose the number of regions to display, you need to use a parameter and a top filter. A parameter is a user-defined variable that can be used in calculations, filters, and reference lines. A top filter is a type of filter that shows only the top or bottom N values based on a specified field or expression.
In this question, you want to filter regions based on the highest sales. You also want users to be able to specify the number of regions shown. To achieve this, you need to follow these steps:
First, you need to create an integer data type parameter named Param1. This parameter will allow users to enter a number that will determine how many regions to show. You can create a parameter by right-clicking on the Data pane and selecting Create Parameter. Then, you need to specify the name, data type, current value, and allowable values for the parameter. In this case, you can choose Integer as the data type, 10 as the current value, and All as the allowable values. You also need to show the parameter control by right-clicking on the parameter and selecting Show Parameter Control. This will display a slider or a text box where users can enter or adjust the parameter value.
Next, you need to drag Region to the Filters shelf. This will open the Filter dialog box, where you can choose how to filter the Region field. You can filter by general, wildcard, condition, or top. In this case, you want to filter by top, so you need to select the Top tab.
Finally, you need to configure a top filter by field. Use Param1 and filter by the sum of Sales. This will filter the Region field by showing only the top N regions based on the sum of Sales, where N is the value of the parameter Param1. You can configure a top filter by field by selecting By field in the Top tab, then choosing the parameter Param1 from the drop-down list, and selecting the aggregation function Sum and the field Sales from the other drop-down lists. This will create a filter expression that looks like this: Top Param1 by SUM(Sales).
By following these steps, you will create a filter that shows only the regions with the highest sales, and allows users to change the number of regions shown by adjusting the parameter value.
References:
Tableau Certified Data Analyst Exam Prep Guide, page 10, section "Filtering Data" Tableau Help: Parameters Tableau Help: Top Filters
質問 # 50
2 軸グラフを持つビジュアライゼーションを作成する予定です。2 軸グラフには形状グラフが含まれ、折れ線グラフでは、軸に人口という名前の同じメジャーが使用されます。
線よりもはるかに大きくなるように形状を構成する必要があります。
あなたは何をするべきか?
- A. デフォルトの形状よりも大きいカスタム形状を作成し、その形状をマイ リポジトリの Shapes フォルダーに追加します。
- B. 人口を個別の次元に変更します
- C. 人口の複製 複製を 2 番目のマーク カードにドラッグし、マークの表示を個別に構成します。
- D. 2 番目の軸については、[マーク] カードで [形状] を選択します。[形状パレットの選択] から [カスタム] を選択し、[リセット] を選択します。
正解:C
解説:
To configure the shapes to be much larger than the line, you need to duplicate Population and drag it to the second Marks card. This will create a dual axis chart with two measures on one axis. You can then select Shape on one Marks card and Line on another Marks card, and adjust the size of each mark independently using the Size slider or menu. References:
https://help.tableau.com/current/pro/desktop/en-us/multiplemeasures_dualaxes.htm
https://help.tableau.com/current/pro/desktop/en-us/marks_markproperties_size.htm In a dual-axis chart in Tableau, if you want to have two different visual mark types (like a shape and a line) and configure them differently (such as making one larger than the other), you would need to duplicate the measure. You then drag this duplicate to the second Marks card (which represents the second axis). There, you can adjust the size of the marks (shapes, in this case) independently of the line marks on the first Marks card.
質問 # 51
月ごとの平均売上を示す次の折れ線グラフがあります。
2019 年の前月と比較して、スエージの売上が最も増加したのはどの月ですか?
- A. 10月
- B. 8月
- C. 11月
- D. 12月
正解:C
質問 # 52
次の地図があります。
次のビジュアライゼーションに示すようにマップが表示される必要があります。
あなたは何をするべきか?
- A. マーク カードの位置をサイズにドラッグします。
- B. [マーク] カードの [サイズ] まで人口をドラッグします。
- C. マークの種類をマップに変更します。
- D. マークの種類を濃度に変更します。
- E. 不透明度を75%に変更します
正解:D
質問 # 53
月ごとの平均売上を示す次の折れ線グラフがあります。
2019 年の前月と比較して、スエージの売上が最も増加したのはどの月ですか?
- A. 11月
- B. 8月
- C. 10月
- D. 12月
正解:C
解説:
To find the month that had the biggest increase in average sales compared to the previous month in 2019, you need to compare the slopes of the line segments between each pair of months. The steeper the slope, the greater the increase. Based on the line chart, October had the steepest slope, meaning it had the biggest increase in average sales compared to September in 2019. Reference: https://help.tableau.com/current/pro/desktop/en-us/buildexamples_line.htm https://www.mathsisfun.com/algebra/line-equation-slope.html
質問 # 54
人々と彼らが獲得した賞を含むデータセットがあります。
受賞したさまざまな種類の賞の数を取得するには、どの式を使用する必要がありますか?
- A. COUNTD {(NAME])
- B. COUNTD({Award})
- C. INDEX()
- D. COVAR({Award})
- E. MAX {(Award})
正解:A
質問 # 55
2 つのシートを含む次のダッシュボードを作成するとします。
あなたは何をするべきか?
- A. 両方のシートを水平コンテナに追加し、コンテナに境界線を追加します。
- B. 両方のシートに境界線を追加し、両方のシートを水平オブジェクトに追加します。
- C. 両方のシートをダッシュボードにドラッグし、各シートに背景を追加します。
- D. 両方のシートをダッシュボードにドラッグし、各シートに枠線を追加します。
正解:A
質問 # 56
図書館の本に関するデータを含む Mowing の 2 つのテーブルがあります。

両方の表が不完全であるため、表から欠落している本があります。
テーブルを組み合わせる必要があります。ソリューションでは、すべてのデータが確実に保持されるようにする必要があります。どのタイプの結合を使用する必要がありますか?
- A. 完全外部結合
- B. 左結合
- C. 右結合
- D. 内部結合
正解:A
解説:
To combine the two tables that contain data about books in a library and ensure that all the data is retained, you should use a full outer join. A full outer join is a type of join that returns all rows from both tables, regardless of whether there is a match or not. If there is no match, null values are filled in for the missing fields.
To perform a full outer join, you need to do the following steps:
Connect to both tables as your data sources in Tableau. You can use either live or extract connections.
Drag one table to the canvas and drop it on top of another table. This will create a join between them based on a common field.
Click on the join icon between the tables and select Full Outer Join from the drop-down list. This will change the join type to full outer join and show all rows from both tables.
Optionally, you can add or remove join clauses by clicking on Add or Remove buttons next to each clause. You can also change or rename fields by clicking on them.
The other types of joins are not correct for this scenario. An inner join returns only the rows that have a match in both tables, which will exclude any books that are missing from either table. A left join returns all rows from the left table and only the matching rows from the right table, which will exclude any books that are only in the right table. A right join returns all rows from the right table and only the matching rows from the left table, which will exclude any books that are only in the left table. References:
https://help.tableau.com/current/pro/desktop/en-us/joining_tables.htm
https://help.tableau.com/current/pro/desktop/en-us/join_types.htm
When combining two datasets that are both incomplete and where it's important to retain all data from both sources, a full outer join is appropriate. This type of join ensures that all records from both tables are included in the combined dataset, even if there are no matching records in the other table.
質問 # 57
......
最新のTDA-C01日本語合格保証される試験問題集認証サンプル問題:https://jp.fast2test.com/TDA-C01-JPN-premium-file.html