

[2026年08月22日] 365日更新、有効なFCP_FAZ_AN-7.6知能問題集
ベスト品質のFCP_FAZ_AN-7.6試験問題集でFortinetテスト高得点を目指そう
質問 # 21
Exhibit.
What can you conclude about the output?
- A. The output is ADOM specific
- B. The message rate being lower that the log rate is normal.
- C. Both messages and logs are almost finished indexing.
- D. There are more traffic logs than event logs.
正解:B
解説:
In this output, we see two diagnostic commands executed on a FortiAnalyzer device:
* diagnose fortilogd lograte: This command shows the rate at which logs are being processed by the FortiAnalyzer in terms of log entries per second.
* diagnose fortilogd msgrate: This command displays the message rate, or the rate at which individual messages are being processed.
The values provided in the exhibit output show:
* Log rate (lograte): Consistently high, showing values such as 70.0, 132.1, and 133.3 logs per second over different time intervals.
* Message rate (msgrate): Lower values, around 1.4 to 1.6 messages per second.
Explanation:
* Interpretation of log rate vs. message rate: In FortiAnalyzer, the log rate typically refers to the rate of logs being stored or indexed, while the message rate refers to individual messages within these logs.
Given that a single log entry can contain multiple messages, it's common to see a lower message rate relative to the log rate.
* Understanding normal operation: In this case, the message rate being lower than the log rate is expected and typical behavior. This discrepancy can arise because each log entry may bundle multiple related messages, reducing the message rate relative to the log rate.
Conclusion
* Correct Answer: A. The message rate being lower than the log rate is normal.
* This aligns with the normal operational behavior of FortiAnalyzer in processing logs and messages.
There is no indication that both logs and messages are nearly finished indexing, as that would typically show diminishing rates toward zero, which is not the case here. Additionally, there's no information in this output about specific ADOMs or a comparison between traffic logs and event logs. Thus, options B, C, and D are incorrect.
References:
FortiOS 7.4.1 and FortiAnalyzer 7.4.1 command guides for diagnose fortilogd lograte and diagnose fortilogd msgrate.
質問 # 22
Which statement correctly describes one Difference between templates and reports?
- A. Templates can be cloned, but reports cannot be cloned.
- B. Template are mapped to device groups. while reports are mapped to ADOMs
- C. Reports support macros, but templates do not.
- D. Reports provide more configuration options than templates
正解:D
解説:
Exact Extract: Study Guide p.168-p.172: templates define layout, while reports include report settings and more configuration.
Technical Deep Dive: The correct answer is A. Reports provide more configuration options because they include the layout/template plus operational settings such as time period, target devices, scheduling, filters, output behavior, and advanced settings. Templates contain the Editor-tab layout elements and do not include basic or advanced report settings. Option B is wrong because both reports and templates can be cloned.
Option C is wrong because templates can include macros. Option D is wrong because templates are not mapped to device groups as stated.
質問 # 23
Which two statements regarding FortiAnalyzer operating modes are true? (Choose two.)
- A. You can create and edit reports when FortiAnalyzer is running in collector mode.
- B. When running in collector mode, FortiAnalyzer can forward logs to a syslog server.
- C. FortiAnalyzer runs in collector mode by default unless it is configured for HA.
- D. A topology with FortiAnalyzeer devices running in both modes can improve their performance.
正解:C、D
解説:
FortiAnalyzer has two primary operating modes: Analyzer mode and Collector mode. Each mode serves specific purposes and has distinct capabilities.
Option B - Default Mode is Collector Mode Unless Configured for HA:
When a FortiAnalyzer is initially set up, it runs in Collector mode by default unless it is configured as part of a High Availability (HA) setup, which would set it to Analyzer mode. Collector mode prioritizes log collection and storage rather than analysis, offloading analysis to other devices in the network.
Option D - Performance Improvement with Both Modes in Topology:
Deploying FortiAnalyzer devices in both Collector and Analyzer modes in a network topology can enhance performance. Collector mode devices handle log collection, reducing the workload on Analyzer mode devices, which focus on log processing, analysis, and reporting. This separation of tasks can optimize resource usage and improve the overall efficiency of log management.
質問 # 24
When generating reports on FortiAnalyzer, macros can be used to include additional data. Which two statements about macros are true? (Choose two.)
- A. Macros cannot be customized
- B. Macros are abbreviated dataset queries
- C. Macros are supported in FortiGate ADOMs only
- D. Macros do not need to be associated with a chart
正解:B、D
質問 # 25
A playbook contains five tasks in total. An administrator runs the playbook and four out of five tasks finish successfully, but one task fails.
What will be the status of the playbook after it is run?
- A. Success
- B. Upstream_failed
- C. Failed
- D. Attention required
正解:C
解説:
Playbook jobs that include one or more failed tasks are labeled as Failed in Playbook Monitor. A failed status, however, does not mean that all tasks failed. Some individual actions may have completed successfully.
質問 # 26
Which two parameters does FortiAnalyzer use to identify an indicator of compromise (IOC)?
(Choose two.)
- A. Application category
- B. Policy ID
- C. URL
- D. IP address
正解:C、D
質問 # 27
Which statement about SQL SELECT queries is true?
- A. They must be followed immediately by a WHERE clause.
- B. They can be used to purge log entries from the database.
- C. They can be used to display the database schema.
- D. They are not used in macros.
正解:D
解説:
FortiAnalyzer and similar systems often use macros for automated functions or specific query- based tasks. SELECT queries are typically not included in macros because macros focus on procedural or repetitive actions, rather than simple data retrieval.
質問 # 28
Which FortiAnalyzer feature allows you to use a proactive approach when managing your network security?
- A. Outbreak alert services
- B. Threat hunting
- C. Incidents dashboard
- D. FortiView Monitor
正解:B
解説:
FortiAnalyzer offers several features for monitoring, alerting, and incident management, each serving different purposes. Let's examine each option to determine which one best supports a proactive security approach.
* Option A - FortiView Monitor:
* FortiView is a visualization tool that provides real-time and historical insights into network traffic, threats, and logs. While it gives visibility into network activity, it is generally more reactive than proactive, as it relies on existing log data and incidents.
* Conclusion: Incorrect.
* Option B - Outbreak Alert Services:
* Outbreak Alert Services in FortiAnalyzer notify administrators of emerging threats and outbreaks based on FortiGuard intelligence. This is beneficial for awareness of potential threats but does not offer a hands-on, investigative approach. It's more of a notification service rather than an active, proactive investigation tool.
* Conclusion: Incorrect.
* Option C - Incidents Dashboard:
* The Incidents Dashboard provides a summary of incidents and current security statuses within the network. While it assists with ongoing incident response, it is used to manage and track existing incidents rather than proactively identifying new threats.
* Conclusion: Incorrect.
* Option D - Threat Hunting:
* Threat Hunting in FortiAnalyzer enables security analysts to actively search for hidden threats or malicious activities within the network by leveraging historical data, analytics, and intelligence.
This is a proactive approach as it allows analysts to seek out threats before they escalate into incidents.
* Conclusion: Correct.
Conclusion:
* Correct Answer: D. Threat hunting
* Threat hunting is the most proactive feature among the options, as it involves actively searching for threats within the network rather than reacting to already detected incidents.
References:
FortiAnalyzer 7.4.1 documentation on Threat Hunting and proactive security measures.
質問 # 29
Which two actions should an administrator take to vide Compromised Hosts on FortiAnalyzer?
(Choose two.)
- A. Make sure all endpoints are reachable by FortiAnalyzer.
- B. Subscribe FortiAnalyzer to FortiGuard to keep its local threat database up to date.
- C. Enable device detection on the FotiGate device that are sending logs to FortiAnalyzer.
- D. Enable web filtering in firewall policies on FortiGate devices, and make sure these logs are sent to fortiAnalyzer.
正解:C、D
解説:
To view Compromised Hosts on FortiAnalyzer, certain configurations need to be in place on both FortiGate and FortiAnalyzer. Compromised Host data on FortiAnalyzer relies on log information from FortiGate to analyze threats and compromised activities effectively.
Option A: Enable device detection on the FortiGate devices that are sending logs to FortiAnalyzer Enabling device detection on FortiGate allows it to recognize and log devices within the network, sending critical information about hosts that could be compromised. This is essential because FortiAnalyzer relies on these logs to determine which hosts may be at risk based on suspicious activities observed by FortiGate. This setting enables FortiGate to provide device-level insights, which FortiAnalyzer uses to populate the Compromised Hosts view.
Option B: Enable web filtering in firewall policies on FortiGate devices, and make sure these logs are sent to FortiAnalyzer Web filtering is crucial in identifying potentially compromised hosts since it logs any access to malicious sites or blocked categories. FortiAnalyzer uses these web filter logs to detect suspicious or malicious web activity, which can indicate compromised hosts. By ensuring that FortiGate sends these web filtering logs to FortiAnalyzer, the administrator enables FortiAnalyzer to analyze and identify hosts engaging in risky behavior.
質問 # 30
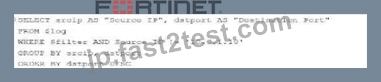
Exhibit.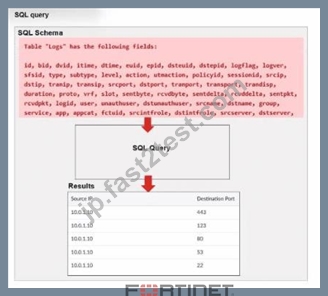
A FortiAnalyzer analyst is customizing a SQL query to use in a report.
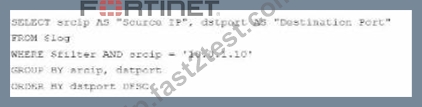
Which SQL query should the analyst run to get the expected results?
- A.
- B.
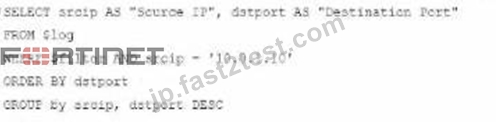
- C.
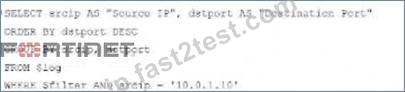
- D.
正解:B
解説:
Exact Extract: Study Guide p.157-p.158: report datasets use SQL SELECT queries, and clauses must be in the correct order.
Technical Deep Dive: The correct answer is A. The valid query must select the required fields, read from
$log, apply the filter for the source IP, group the selected values, and order the output as expected. Option A follows the SQL structure FortiAnalyzer expects for report datasets. The incorrect options either reverse the filter logic, place clauses in the wrong order, or use malformed aliases/conditions. In FortiAnalyzer reporting, a syntactically correct dataset is mandatory because the chart receives only the data returned by that SQL SELECT query.
質問 # 31
Exhibit. What can you conclude about the output?
- A. The output is ADOM specific
- B. The message rate being lower that the log rate is normal.
- C. Both messages and logs are almost finished indexing.
- D. There are more traffic logs than event logs.
正解:B
質問 # 32
Which two statements about exporting and importing playbacks are true? (Choose two.)
- A. A playbook that was disabled when it was exported mil be disabled when it is imported.
- B. Playbooks can so imported 10 a different FortiAnayzer device, but only if the connectors already exist
- C. You can import a playbook even if there is another one win the same name in the destination
- D. You can export only one playbook at a time.
正解:A、B
質問 # 33
Which operation can you use SQL SELECTqueries for?
- A. To purge log entries from the database
- B. To alter tables in the database
- C. To insert new data into an existing table
- D. To display the database schema
正解:D
解説:
To create a query, you first need to know what is included in the database schema. The schema is the different fields, or columns, that are available, and from which you can extract information for reports. In FortiAnalyzer, you can obtain the schema for a specific log type by creating and testing the following dataset query:
SELECT * FROM $log,
This query can be read as: "Select everything from the logs table."
For traffic logs, for example, associate the Traffic log type with this dataset in the Log Type field.
This query returns everything from the Traffic log type. The column heading names indicate what is available in the database schema for the log type selected. The * symbol returns all data. Note that not all column headings are shown in the example on this slide.
質問 # 34
Exhibit.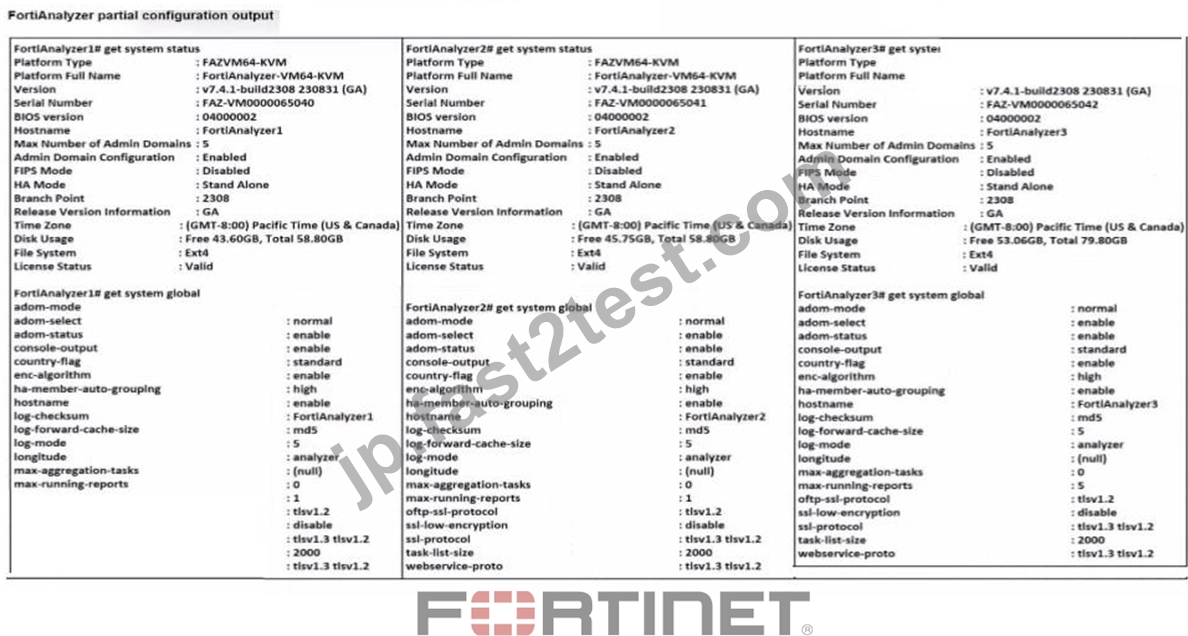
Based on the partial outputs displayed, which devices can be members of a FotiAnalyzer Fabric?
- A. FortiAnalayzer1 and FortiAnalyzer3
- B. FortiAnalyzer2 and FortiAnalyzer3
- C. FortiAnalyzer1 and FortiAnalyzer2
- D. All devices listed can be members.
正解:D
解説:
In a FortiAnalyzer Fabric, devices can participate in a cluster or grouping if they meet specific compatibility criteria. Based on the outputs provided, let's evaluate these criteria:
* Version Compatibility:
* All three devices, FortiAnalyzer1, FortiAnalyzer2, and FortiAnalyzer3, are running version v7.
4.1-build0238, which is the same across the board. This version alignment is crucial because FortiAnalyzer Fabric requires that devices run compatible firmware versions for seamless communication and management.
* Platform Type and Configuration:
* All three devices are configured as Standalone in the HA mode, which allows them to operate independently but does not restrict their participation in a FortiAnalyzer Fabric. Each device is also on the FAZVM64-KVM platform type, ensuring hardware compatibility.
* Global Settings:
* Key settings such as adm-mode, adm-status, and adom-mode are consistent across all devices (adm-mode: normal, adm-status: enable, adom-mode: normal), which aligns with requirements for fabric integration and role assignment flexibility.
* Each device also has the log-forward-cache-size set, which is relevant for forwarding logs within a fabric environment.
Based on the above analysis, all devices (FortiAnalyzer1, FortiAnalyzer2, and FortiAnalyzer3) meet the requirements to be part of a FortiAnalyzer Fabric.
* FortiAnalyzer 7.4.1 documentation outlines that devices within a FortiAnalyzer Fabric should be on the same or compatible firmware versions and hardware platforms, and they must be configured for integration.
Given that all devices match the version, platform, and mode criteria, they can all be part of the FortiAnalyzer Fabric.
質問 # 35
Refer to the exhibit. The playbook shown in the exhibit requires fine-tuning. A task needs to be configured to run a report on the updated asset list that the FortiAnalyzer receives from the FortiClient EMS.
Which SOC role is responsible for making this change?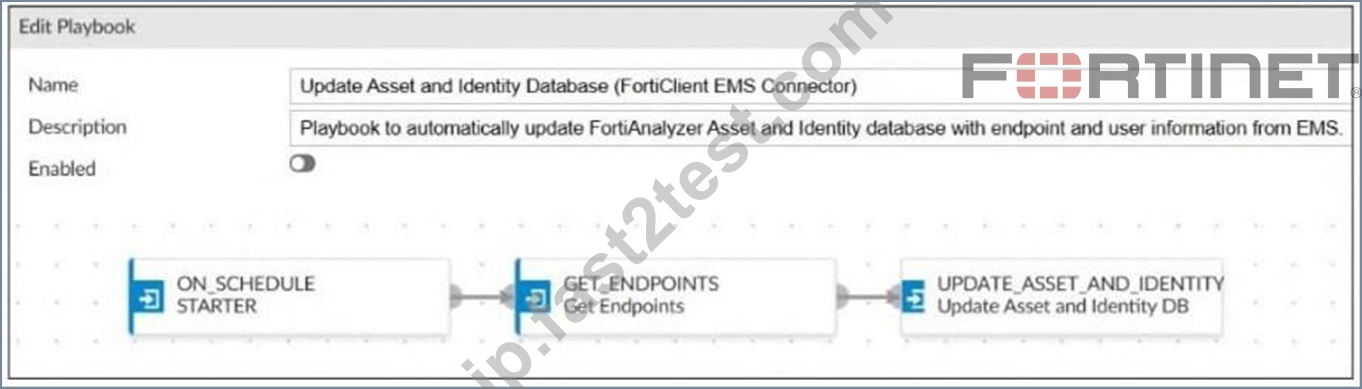
- A. Security analyst
- B. SOC engineer
- C. Threat hunter
- D. Incident responder
正解:B
解説:
Modifying or extending playbooks - such as adding tasks to run reports - is the responsibility of the SOC engineer, who manages automation workflows, integrations, and system configurations within FortiAnalyzer.
質問 # 36
Refer to the exhibit.
What can you conclude about the output?
- A. The log rate higher than the message rate is not normal.
- B. The low indexing values require investigation.
- C. There are more event logs than traffic logs.
- D. The output is not ADOM specific.
正解:A
質問 # 37
(Refer to the exhibit.
Which statement about the displayed event is correct? (Choose one answer))
- A. The security event risk is considered open.
- B. The security risk was escalated.
- C. An incident was created from this event.
- D. The risk source is isolated.
正解:A
解説:
Comprehensive and Detailed Explanation From Exact Extract of knowledge of FortiAnalyzer 7.6 Study guide documents:
In the exhibit, the Event Status shown is Unhandled (Event Type: Web Filter; Severity: Critical). The FortiAnalyzer study guide defines Unhandled events as events whose security risk has not been addressed and is therefore still active/open. Specifically, it states: "Unhandled: The security risk is considered open." This directly matches option D.
The other options correspond to different statuses or actions:
* Isolated/Contained applies when the risk source is isolated (status Contained), not Unhandled.
* Escalated refers to events moved/raised for further action (status Escalated), not Unhandled.
* Whether an incident was created cannot be concluded solely from the status "Unhandled" in the exhibit; the study guide ties incident creation to incident management workflows rather than equating
"Unhandled" with an incident being created.
質問 # 38
Which two statements about playbook execution are true? (Choose two.)
- A. FortiAnalyzer will commit changes made by a Failed playbook.
- B. You can run the default debugging playbook to investigate playbook errors.
- C. If the playbook status is Failed, all individual tasks in the playbook will fail.
- D. The Playbook Monitor provides troubleshooting logs.
正解:B、D
解説:
FortiAnalyzer provides a default debugging playbook that can be used to help investigate and troubleshoot playbook execution errors. The Playbook Monitor displays execution details and logs, which assist in identifying the cause of failures and analyzing task behavior during playbook runs.
質問 # 39
What happens when the indicator of compromise (IOC) engine on FortiAnalyzer finds web logs that match blacklisted IP addresses?
- A. FortiAnalyzer flags the associated host for further analysis.
- B. A new infected entry is added for the corresponding endpoint under Compromised Hosts.
- C. The detection engine classifies those logs as Suspicious.
- D. The endpoint is marked as Compromised and, optionally, can be put in quarantine.
正解:B
解説:
Exact Extract: Study Guide p.130-p.132: blacklisted IP or DGA matches produce an Infected verdict and appear under Compromised Hosts.
Technical Deep Dive: The correct answer is B. When IOC analysis finds web logs matching blacklisted IP addresses or domain-generation algorithm patterns, FortiAnalyzer treats that as a real breach and creates
/updates an infected compromised-host entry for the endpoint. Option A describes suspicious-list behavior, where FortiAnalyzer flags the host for further analysis. Option C is wrong because blacklisted matches are classified as Infected, not merely Suspicious. Option D overstates the automatic endpoint response; quarantine is a separate response action, not the IOC engine classification itself.
質問 # 40
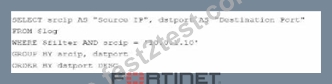
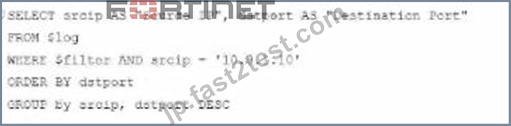
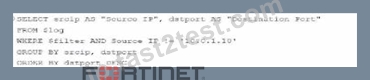
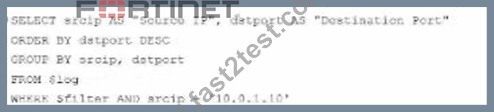
Exhibit. A fortiAnalyzer analyst is customizing a SQL query to use in a report. Which SQL query should the analyst run to get the expected results?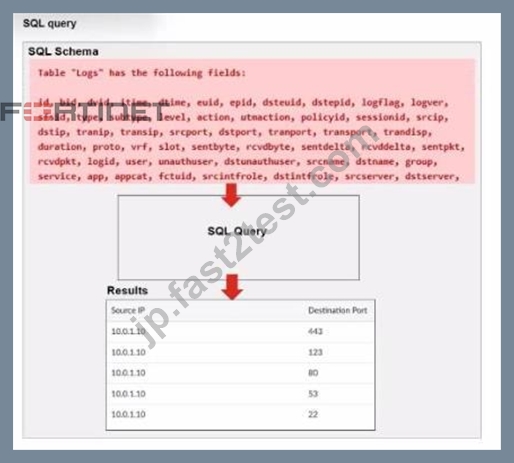
- A.
- B.
- C.
- D.
正解:B
解説:
The requirement here is to construct a SQL query that retrieves logs with specific fields, namely
"Source IP" and "Destination Port," for entries where the source IP address matches 10.0.1.10.
The correct syntax is essential for selecting, filtering, ordering, and grouping the results as shown in the expected outcome.
質問 # 41
Which two statements about local logs on FortiAnalyzer are true? (Choose two.)
- A. Event logs are available only in the root ADOM.
- B. They are not supported in FortiView.
- C. You can view playbook logs for all ADOMs in the root ADOM.
- D. Event logs show system-wide information, whereas application logs are ADOM-specific.
正解:A、D
解説:
Exact Extract: Study Guide p.59: event logs show system-wide information; application logs are ADOM- specific, and non-root ADOMs show only application logs.
Technical Deep Dive: The correct answers are C and D. FortiAnalyzer local logs include system-wide event logs and ADOM-specific application logs. Because non-root ADOMs show only application logs, system event logs are effectively a root-ADOM visibility item. Option A is wrong because local audit logs are accessible in Log View under ADOMs. Option B overstates playbook visibility; playbook/application logs are ADOM-specific and should not be treated as all centralized in root for every ADOM.
質問 # 42
Which three modules does FortiAnalyzer automatically download content from with a valid SOC Automation service license? (Choose three.)
- A. Dashboards
- B. Playbooks
- C. Incident templates
- D. Active Connectors
- E. Report templates
- F. Event handlers
正解:B、C、F
解説:
With a valid SOC Automation service license, FortiAnalyzer receives automatic updates for these specific content types:
Event handlers: These define how FortiAnalyzer processes and responds to specific security events.
Playbooks: These are automated workflows used to investigate and respond to security incidents.
Incident templates: These provide predefined structures for classifying and managing security incidents.
質問 # 43
An administrator on your team has configured multiple reports to run periodically. Management has an additional request that all new generated reports be sent to a company email inbox for accessibility. The mail server has already been configured on FortiAnalyzer.
Which item must you configure on FortiAnalyzer so that emails are sent when the reports are generated?
- A. Add a mailto:<email address> option within the report layouts.
- B. Enable an output profile on the reports.
- C. Enable email notification under the report calendar.
- D. Enable the option to email all repots under the mail server.
正解:B
解説:
In FortiAnalyzer, reports can be sent by email only if an output profile is configured and assigned to them. The output profile defines the delivery method (such as email), and uses the already configured mail server to send the reports.
質問 # 44
Which statement about SQL SELECT queries is true?
- A. They must be followed immediately by a WHERE clause.
- B. They are not used in macros.
- C. They can be used to purge log entries from the database.
- D. They can be used to display the database schema.
正解:D
解説:
Exact Extract: Study Guide p.159: SELECT * FROM $log can be used to obtain the schema for a selected log type.
Technical Deep Dive: The correct answer is C. FortiAnalyzer datasets use SQL SELECT queries not only to extract report data but also to reveal available columns for a log type. Running SELECT * FROM $log and testing the dataset shows the column headings available in the database schema. Option A is wrong because SELECT is read-only and does not purge data. Option B is wrong because WHERE is optional; FROM is the mandatory clause. Option D is wrong because macros represent dataset queries in abbreviated form, so SELECT logic is directly related to macros.
質問 # 45
......
注目すべき時短になるFCP_FAZ_AN-7.6オールインワン試験ガイド:https://jp.fast2test.com/FCP_FAZ_AN-7.6-premium-file.html
検証された材料は決まってこれ!FCP_FAZ_AN-7.6:https://drive.google.com/open?id=16MzJwznuPAf54dhsh4TFirn-90nO1xu3