

[2026年08月21日] 完全版最新の問題集でPDFで最新DP-600日本語試験問題と解答
無料で使えるDP-600日本語試験問題集で100%合格できる試験簡単に合格させるFast2test
質問 # 96
Staging.Sales というテーブルを含む Fabric ウェアハウスがあります。Staging.Sales には次の列が含まれています。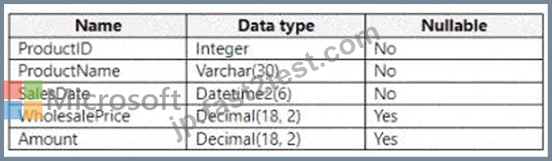
2023年のProductIDとProductNameを表示するT-SQLクエリを作成する必要があります。arxlには10,000を超える集計されたAmountがあります。どのクエリを使用すればよいですか?
- A.

- B.

- C.

- D.

正解:B
解説:
The correct query to use in order to return data for the year 2023 that displays ProductID, ProductName, and has a summarized Amount greater than 10,000 is Option B. The reason is that it uses the GROUP BY clause to organize the data by ProductID and ProductName and then filters the result using the HAVING clause to only include groups where the sum of Amount is greater than 10,000. Additionally, the DATEPART(YEAR, SaleDate) = '2023' part of the HAVING clause ensures that only records from the year 2023 are included.
References = For more information, please visit the official documentation on T-SQL queries and the GROUP BY clause at T-SQL GROUP BY.
質問 # 97
OneLake に JSON ファイルを含む Fabric テナントがあります。ファイルには 10 億項目あります。
項目の時系列分析を実行する予定です。
データを変換し、データを視覚化して洞察を見つけ、異常検出を実行し、その洞察を他のビジネス ユーザーと共有する必要があります。ソリューションは、次の要件を満たす必要があります。
- 並列処理を使用します。
- データの重複を最小限に抑えます。
- データの読み込みにかかる時間を最小限に抑えます。
データを変換して視覚化するには何を使用すればよいでしょうか?
- A. コアビジュアルを使用する Microsoft Power BI レポート
- B. Fabric ノートブックの pandas ライブラリ
- C. Fabric ノートブックの PySpark ライブラリ
正解:C
解説:
PySpark provides robust capabilities for data transformation and manipulation, making it well- suited for preparing data for time series analysis. You can then use libraries like pandas for further data manipulation if needed and leverage Spark's machine learning capabilities for anomaly detection.
質問 # 98
Fabricテナントをお持ちの場合
Pipeline1 というデータパイプラインを作成する予定です。Pipeline1 には、順番に実行される 2 つのアクティビティが含まれます。最初のアクティビティが失敗しても、2 番目のアクティビティがブロックされないようにする必要があります。最初のアクティビティと 2 番目のアクティビティの間には、どのような条件付きパスを設定する必要がありますか?
- A. スキップ時
- B. 失敗した場合
- C. 完了時
- D. 成功時
正解:C
解説:
Upon Success: downstream runs only if the first activity succeeds.
Upon Failure: downstream runs only if the first activity fails.
Upon Skip: downstream runs if the activity was skipped.
Upon Completion: downstream runs regardless of whether the first activity succeeded or failed.
Since we want the second activity to run even if the first fails, the correct answer is Upon Completion.
Reference: Pipeline activity dependencies in Fabric Data Factory
質問 # 99
Workspace1 という名前のワークスペースを含む Fabric テナントがあります。
XMLA エンドポイントを使用して、Model1 という名前のセマンティック モデルを展開する予定です。
Model1の導入を最適化する必要があります。ソリューションは、Model1の導入にかかる時間を最小限に抑える必要があります。
Workspace1 では何をすればよいでしょうか?
- A. ショートカットのキャッシュを有効にするをオンに設定します。
- B. 大規模なセマンティック モデル ストレージ形式を選択します。
- C. 小規模なセマンティック モデル ストレージ形式を選択します。
- D. 選択すると、ユーザーは Power BI サービスでデータ モデルを編集できます。
正解:C
解説:
When using XMLA endpoint for deployment or processing , the semantic model storage format impacts deployment times.
Small storage format allows faster metadata operations and shorter deployment times.
Large semantic model storage format is only needed for extremely large models ( > 10 GB dataset limit), and it increases deployment overhead.
The other options (B: service editing, C: cache for shortcuts) are unrelated to XMLA endpoint deployment performance.
Reference:
Power BI semantic model storage format
質問 # 100
ホットスポットに関する質問
Fabricイベントハウス内にKQLデータベースがあります。このデータベースには、TaxiDataという名前のテーブルがあり、以下のデータが格納されています。
tpep_pickup_datetime テーブルから、payment_type で分割された各時間の最初の値を格納する FirstPickupDateTime という名前の列を作成する必要があります。
質問にはどのように回答すればよいですか?回答するには、回答欄で適切なオプションを選択してください。
注:正解ごとに1ポイントが加算されます。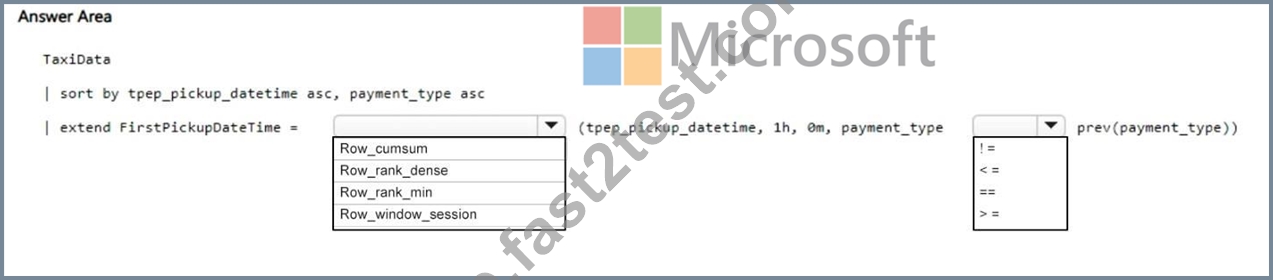
正解:
解説:
Explanation:
Box 1: Row_Window_Session
Kusto, KQL Windowing Functions - Row_Window_Session
The row_window_session function can be used to group rows of data in a time range, and will return the starting time for that range of data in each row.
Box 2: !=
Here we are using an equation, which will compare the payment_type for the current row to the one of the previous row using the prev Windowing Function. If they are not equal, the comparison will return true and trigger Row_Window_Session to begin a Row_Window_Session grouping.
質問 # 101
Workspace1 という名前の Fabric ワークスペースがあります。
Model1 という名前のセマンティック モデルを作成し、Model1 を Workspace1 に公開する必要があります。ソリューションは次の要件を満たしている必要があります。
- 必要に応じて、Model1 の以前のバージョンに戻すことができます。
- Model1 の保存されたバージョン間の違いを識別します。
- Microsoft Power BI Desktop を使用して Workspace1 に公開します。
- Microsoft Visual Studio Code を使用してアイテム定義ファイルを編集できます。
実行すべき 2 つのアクションはどれですか? それぞれの正解は解決策の一部を示しています。
注意: 正しい選択ごとに 1 ポイントが付与されます。
- A. Model1 を Power BI Desktop に PBIP ファイルとして保存します。
- B. Workspace1 の Git 統合を有効にします。
- C. ユーザーが Power BI サービスでデータ モデルを編集できるようにします。
- D. Model1 を Power BI Desktop に PBIT ファイルとして保存します。
正解:A、B
質問 # 102
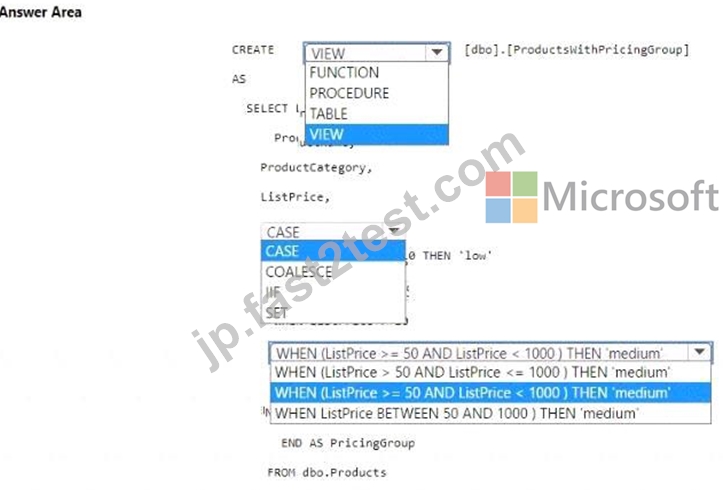
価格設定グループの分類に関する問題を解決する必要があります。
T-SQL ステートメントはどのように完成させるべきでしょうか?回答するには、回答領域で適切なオプションを選択してください。
注: 正しく選択するたびに 1 ポイントの価値があります。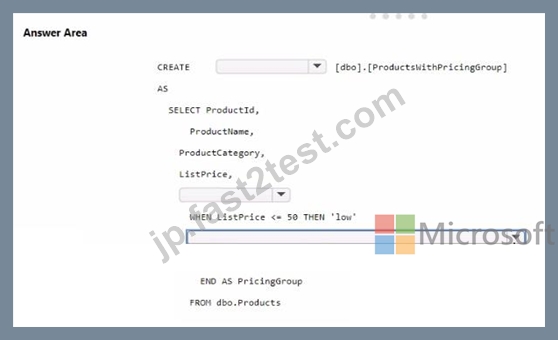
正解:
解説:
Explanation:
* You should use CREATE VIEW to make the pricing group logic available for T-SQL queries.
* The CASE statement should be used to determine the pricing group based on the list price.
The T-SQL statement should create a view that classifies products into pricing groups based on the list price.
The CASE statement is the correct conditional logic to assign each product to the appropriate pricing group.
This view will standardize the pricing group logic across different databases and semantic models.
質問 # 103
Fabricテナントには、OneLakeにParquetファイルとして保存された顧客離脱データが含まれています。
このデータには、顧客の人口統計情報と製品の使用状況に関する詳細情報が含まれています。
データをSpark DataFrameに読み込むためのFabricノートブックを作成します。次に、ノートブック内に列グラフを作成し、地域、購入製品数、年齢、顧客期間に基づいて、維持顧客と離脱顧客の分布を示します。
どのような種類の分析を行っていますか?
- A. 規範的
- B. 診断
- C. 記述的
- D. 予測
正解:C
解説:
Descriptive analytics tells what happened in the past, presenting it as numbers and visuals in reports and dashboards.
Diagnostic analytics gives the reason why something happened.
Predictive analytics determines the potential outcomes of present and past actions and trends.
Prescriptive analytics offers decision support for the best course of action.
Given the scenario in the question where data is read into a Spark DataFrame and column charts are created to show the distribution of retained customers compared to lost customers based on various factors, this falls under the definition of descriptive analytics. No future predictions or prescriptions are made, nor are reasons for the past events provided.
質問 # 104
レイクハウスを含むファブリック テナントがあります。
Fabric ノートブックを使用して、次のコードを使用して大きな DataFrame を保存しています。
次の各ステートメントについて、そのステートメントが true の場合は [はい] を選択します。それ以外の場合は、「いいえ」を選択します。
注: 正しく選択するたびに 1 ポイントの価値があります。
正解:
解説:
Explanation:
* The results will form a hierarchy of folders for each partition key. - Yes
* The resulting file partitions can be read in parallel across multiple nodes. - Yes
* The resulting file partitions will use file compression. - No
Partitioning data by columns such as year, month, and day, as shown in the DataFrame write operation, organizes the output into a directory hierarchy that reflects the partitioning structure. This organization can improve the performance of read operations, as queries that filter by the partitioned columns can scan only the relevant directories. Moreover, partitioning facilitates parallelism because each partition can be processed independently across different nodes in a distributed system like Spark. However, the code snippet provided does not explicitly specify that file compression should be used, so we cannot assume that the output will be compressed without additional context.
References =
* DataFrame write partitionBy
* Apache Spark optimization with partitioning
質問 # 105
Microsoft Fabric の Power Query エディターのデータ プロファイリング ツールにある以下の機能のうち、各列の値の頻度と分布を、最も頻度の高い値から降順に並べ替えて表示するビジュアルを提供するものはどれですか?
- A. 列の品質
- B. データプレビュー
- C. 列分布
- D. 列プロファイル
正解:C
解説:
Option A is correct because The column distribution feature provides visuals underneath the names of the columns showcasing the frequency and distribution of the values. The data in these visualizations is sorted in descending order from the value with the highest frequency.
Reference:
https://learn.microsoft.com/en-us/power-query/data-profiling-tools
質問 # 106
ホットスポットに関する質問
WH1という名前の倉庫を含むFabricテナントをお持ちです。
以下のフィールドを含むCSVファイル形式のソースデータがあります。
- 販売取引ID
- 販売日
- 顧客コード
- 顧客名
- カスタマーアドレス
- 製品コード
- 製品名
- 量
- 単価
WH1のテーブルにはスター型スキーマを実装する予定です。WH1のディメンションテーブルには、タイプ2の緩やかに変化するディメンション(SCD)ロジックが実装されます。
売上取引分析に使用するテーブルを設計し、ソースデータをロードする必要があります。
CustomerName、CustomerCode、およびSaleDateフィールドには、どのタイプのターゲットテーブルを指定する必要がありますか?回答するには、回答欄で適切なオプションを選択してください。
注:正解ごとに1ポイントが加算されます。
正解:
解説:
質問 # 107
レイクハウスを含むファブリック テナントがあります。
SQL エンドポイントを使用して販売データ ファイルにクエリを実行する予定です。ファイルは Amazon Simple Storage Service (Amazon S3) ストレージ バケットに置かれます。
どのファイル形式を使用するか、およびショートカットを作成する場所を推奨する必要があります。
推奨事項に含めるべき 2 つのアクションはどれですか?それぞれの正解は、解決策の一部を示しています。
注: 各正解は 1 ポイントの価値があります。
- A. [テーブル] セクションにショートカットを作成します。
- B. Parquet 形式を使用します
- C. CSV 形式を使用します。
- D. [ファイル] セクションにショートカットを作成します。
- E. デルタ形式を使用します。
正解:A、C
解説:
You should use the Parquet format (B) for the sales data files because it is optimized for performance with large datasets in analytical processing and create a shortcut in the Tables section (D) to facilitate SQL queries through the lakehouse's SQL endpoint. Reference = The best practices for working with file formats and shortcuts in a lakehouse environment are covered in the lakehouse and SQL endpoint documentation provided by the cloud data platform services.
質問 # 108
空のマテリアライズドビューを作成する際の主な特徴は何ですか?
- A. 作成後すぐにクエリに使用可能です。
- B. 作成には時間がかかる場合があります
- C. ソーステーブルからのすべてのレコードが含まれます
- D. マテリアライズドビューは既存のレコードに基づいている必要があります
正解:A
解説:
Option C is CORRECT because Creating an empty materialized view results in it being instantly available for query after creation, as there are no existing records to process.
Reference:
https://learn.microsoft.com/en-us/fabric/real-time-intelligence/materialized-view
質問 # 109
Workspace1 という名前のワークスペースを含む Fabric テナントがあります。
XMLA エンドポイントを使用して、Model1 という名前のセマンティック モデルを展開する予定です。
Model1の導入を最適化する必要があります。ソリューションは、Model1の導入にかかる時間を最小限に抑える必要があります。
Workspace1 では何をすればよいでしょうか?
- A. ショートカットのキャッシュを有効にするをオンに設定します。
- B. 大規模なセマンティック モデル ストレージ形式を選択します。
- C. 小規模なセマンティック モデル ストレージ形式を選択します。
- D. 選択すると、ユーザーは Power BI サービスでデータ モデルを編集できます。
正解:C
解説:
When using XMLA endpoint for deployment or processing , the semantic model storage format impacts deployment times.
Small storage format allows faster metadata operations and shorter deployment times.
Large semantic model storage format is only needed for extremely large models ( > 10 GB dataset limit), and it increases deployment overhead.
The other options (B: service editing, C: cache for shortcuts) are unrelated to XMLA endpoint deployment performance.
Reference:
Power BI semantic model storage format
answer: A. Select Small semantic model storage format.
質問 # 110
AnalyticsPOC ワークスペースのデータ ストアに顧客データを取り込むには何を使用することを推奨しますか?
- A. データフロー
- B. ストアド プロシージャ
- C. Spark ノートブック
- D. KQL アクティビティを含むパイプライン
正解:A
解説:
For ingesting customer data into the data store in the AnalyticsPOC workspace, a dataflow (D) should be recommended. Dataflows are designed within the Power BI service to ingest, cleanse, transform, and load data into the Power BI environment. They allow for the low-code ingestion and transformation of data as needed by Litware's technical requirements. Reference = You can learn more about dataflows and their use in Power BI environments in Microsoft's Power BI documentation.
Topic 1, Litware. Inc.
Overview
Litware. Inc. is a manufacturing company that has offices throughout North America. The analytics team at Litware contains data engineers, analytics engineers, data analysts, and data scientists.
Existing Environment
litware has been using a Microsoft Power Bl tenant for three years. Litware has NOT enabled any Fabric capacities and features.
Fabric Environment
Litware has data that must be analyzed as shown in the following table.
The Product data contains a single table and the following columns.
The customer satisfaction data contains the following tables:
* Survey
* Question
* Response
For each survey submitted, the following occurs:
* One row is added to the Survey table.
* One row is added to the Response table for each question in the survey.
The Question table contains the text of each survey question. The third question in each survey response is an overall satisfaction score. Customers can submit a survey after each purchase.
User Problems
The analytics team has large volumes of data, some of which is semi-structured. The team wants to use Fabric to create a new data store.
Product data is often classified into three pricing groups: high, medium, and low. This logic is implemented in several databases and semantic models, but the logic does NOT always match across implementations.
Planned Changes
Litware plans to enable Fabric features in the existing tenant. The analytics team will create a new data store as a proof of concept (PoC). The remaining Litware users will only get access to the Fabric features once the PoC is complete. The PoC will be completed by using a Fabric trial capacity.
The following three workspaces will be created:
* AnalyticsPOC: Will contain the data store, semantic models, reports, pipelines, dataflows, and notebooks used to populate the data store
* DataEngPOC: Will contain all the pipelines, dataflows, and notebooks used to populate Onelake
* DataSciPOC: Will contain all the notebooks and reports created by the data scientists The following will be created in the AnalyticsPOC workspace:
* A data store (type to be decided)
* A custom semantic model
* A default semantic model
* Interactive reports
The data engineers will create data pipelines to load data to OneLake either hourly or daily depending on the data source. The analytics engineers will create processes to ingest transform, and load the data to the data store in the AnalyticsPOC workspace daily. Whenever possible, the data engineers will use low-code tools for data ingestion. The choice of which data cleansing and transformation tools to use will be at the data engineers' discretion.
All the semantic models and reports in the Analytics POC workspace will use the data store as the sole data source.
Technical Requirements
The data store must support the following:
* Read access by using T-SQL or Python
* Semi-structured and unstructured data
* Row-level security (RLS) for users executing T-SQL queries
Files loaded by the data engineers to OneLake will be stored in the Parquet format and will meet Delta Lake specifications.
Data will be loaded without transformation in one area of the AnalyticsPOC data store. The data will then be cleansed, merged, and transformed into a dimensional model.
The data load process must ensure that the raw and cleansed data is updated completely before populating the dimensional model.
The dimensional model must contain a date dimension. There is no existing data source for the date dimension. The Litware fiscal year matches the calendar year. The date dimension must always contain dates from 2010 through the end of the current year.
The product pricing group logic must be maintained by the analytics engineers in a single location. The pricing group data must be made available in the data store for T-SQL queries and in the default semantic model. The following logic must be used:
* List prices that are less than or equal to 50 are in the low pricing group.
* List prices that are greater than 50 and less than or equal to 1,000 are in the medium pricing group.
* List pnces that are greater than 1,000 are in the high pricing group.
Security Requirements
Only Fabric administrators and the analytics team must be able to see the Fabric items created as part of the PoC. Litware identifies the following security requirements for the Fabric items in the AnalyticsPOC workspace:
* Fabric administrators will be the workspace administrators.
* The data engineers must be able to read from and write to the data store. No access must be granted to datasets or reports.
* The analytics engineers must be able to read from, write to, and create schemas in the data store. They also must be able to create and share semantic models with the data analysts and view and modify all reports in the workspace.
* The data scientists must be able to read from the data store, but not write to it. They will access the data by using a Spark notebook.
* The data analysts must have read access to only the dimensional model objects in the data store. They also must have access to create Power Bl reports by using the semantic models created by the analytics engineers.
* The date dimension must be available to all users of the data store.
* The principle of least privilege must be followed.
Both the default and custom semantic models must include only tables or views from the dimensional model in the data store. Litware already has the following Microsoft Entra security groups:
* FabricAdmins: Fabric administrators
* AnalyticsTeam: All the members of the analytics team
* DataAnalysts: The data analysts on the analytics team
* DataScientists: The data scientists on the analytics team
* Data Engineers: The data engineers on the analytics team
* Analytics Engineers: The analytics engineers on the analytics team
Report Requirements
The data analysis must create a customer satisfaction report that meets the following requirements:
* Enables a user to select a product to filter customer survey responses to only those who have purchased that product
* Displays the average overall satisfaction score of all the surveys submitted during the last 12 months up to a selected date
* Shows data as soon as the data is updated in the data store
* Ensures that the report and the semantic model only contain data from the current and previous year
* Ensures that the report respects any table-level security specified in the source data store
* Minimizes the execution time of report queries
質問 # 111
Microsoft Power BI のセマンティック モデルをお持ちです。
モデル内のサロゲートキー列のうち、「集計基準」プロパティが「なし」以外の値に設定されている列を特定する必要があります。解決策は、作業量を最小限に抑えるものでなければなりません。
何を使うべきでしょうか?
- A. DAX Studio の DAX フォーマッター
- B. Microsoft Power BI Desktop のモデル ビュー
- C. Microsoft Power BI Desktop のモデルエクスプローラー
- D. 表形式エディタのベストプラクティスアナライザー
正解:D
解説:
Best Practice Analyzer should be able to identify these with some rules.
質問 # 112
Workspace1 という名前の Fabric ワークスペースと、storage という名前の Azure Data Lake Storage Gen2 アカウントがあります。Workspace1 には、Lakehouse1 という名前のレイクハウスが含まれています。
Lakehouse1 のストレージへのショートカットを作成する必要があります。
どの接続とエンドポイントを指定する必要がありますか? 回答するには、回答領域で適切なオプションを選択してください。
注意: 正しい選択ごとに 1 ポイントが付与されます。
正解:
解説:
Explanation: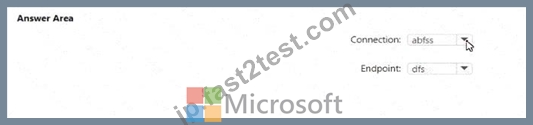
When creating a shortcut to an Azure Data Lake Storage Gen2 account in a lakehouse, you should use the abfss (Azure Blob File System Secure) connection string and the dfs (Data Lake File System) endpoint. The abfss is used for secure access to Azure Data Lake Storage, and the dfs endpoint indicates that the Data Lake Storage Gen2 capabilities are to be used.
質問 # 113
ホットスポットに関する質問
definition.pbir という名前のファイルを含む Microsoft Power BL プロジェクトがあります。 definition.pbir には次の JSON が含まれています。
以下の各記述について、正しい場合は「はい」を選択してください。そうでない場合は「いいえ」を選択してください。
注:正解ごとに1ポイントが加算されます。
以下の各記述について、正しい場合は「はい」を選択してください。そうでない場合は「いいえ」を選択してください。
注:正解ごとに1ポイントが加算されます。
正解:
解説:
質問 # 114
次の KQL クエリがあります。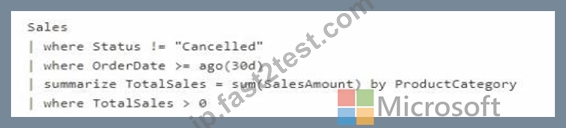
以下の各記述について、正しい場合は「はい」を選択してください。そうでない場合は「いいえ」を選択してください。注:正しい選択肢は1つにつき1点です。
正解:
解説:
Explanation:
We are analyzing this KQL query:
Sales
| where Status != "Cancelled"
| where OrderDate >= ago(30d)
| summarize TotalSales = sum(SalesAmount) by ProductCategory
| where TotalSales > 0
Statement 1:
"The query excludes sales that have a Status of Cancelled."
Yes # where Status != "Cancelled" filters them out.
Statement 2:
"The query calculates the total sales of each product category for the last 30 days." Yes # where OrderDate >= ago(30d) ensures only last 30 days.
summarize TotalSales = sum(SalesAmount) by ProductCategory groups by category.
Statement 3:
"The query includes product categories that have had zero sales during the last 30 days." No # The final filter where TotalSales > 0 excludes categories with zero sales.
Final Answer:
Excludes Cancelled sales # Yes
Calculates total sales by product category for last 30 days # Yes
Includes product categories with zero sales # No
References:
KQL where operator
KQL summarize operator
質問 # 115
ホットスポットに関する質問
あなたは、湖畔の家が2軒あるFabricテナントを所有しています。
あなたは湖畔の住宅からのデータを組み合わせるデータフローを構築しています。データフロー内のクエリの1つから適用されるステップを次の図に示します。
図に示された情報に基づいて、各記述を完成させる選択肢をドロップダウンメニューを使用して選択してください。
注:正解ごとに1ポイントが加算されます。
正解:
解説: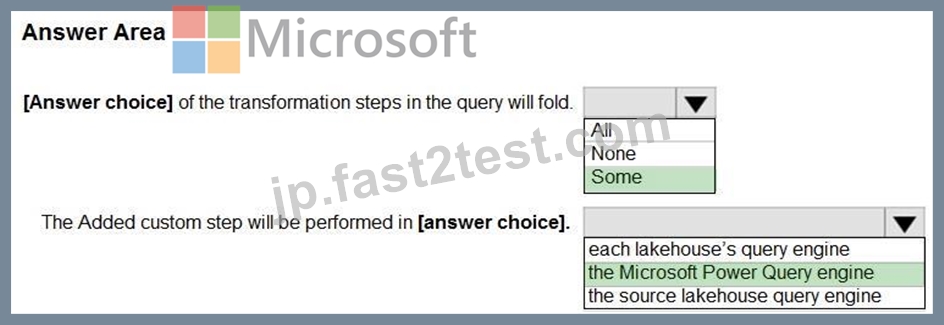
質問 # 116
Lakehouse1 という名前のレイクハウスを含む Fabric テナントがあります。Lakehouse1 には Nyctaxi_raw という名前のテーブルが含まれています。Nyctaxi_raw には次の列が含まれています。
Fabric ノートブックを作成し、lakehouse1 に添付します。
データを変換するにはPySparkコードを使用する必要があります。ソリューションは以下の要件を満たす必要があります。
* pickupDateTime の日付部分のみを含む pickupDate という名前の列を追加します。
* DataFrame をフィルタリングして、fareAmount が 100 未満の正の数値である行のみを含めます。
コードをどのように完成させるべきでしょうか?回答するには、回答エリアで適切なオプションを選択してください。注意:
正しい選択ごとに 1 ポイントが与えられます。
正解:
解説:
Explanation:
* Add the pickupDate column: .withColumn("pickupDate", df["pickupDateTime"].cast("date"))
* Filter the DataFrame: .filter("fareAmount > 0 AND fareAmount < 100")
In PySpark, you can add a new column to a DataFrame using the .withColumn method, where the first argument is the new column name and the second argument is the expression to generate the content of the new column. Here, we use the .cast("date") function to extract only the date part from a timestamp. To filter the DataFrame, you use the .filter method with a condition that selects rows where fareAmount is greater than 0 and less than 100, thus ensuring only positive values less than 100 are included.
質問 # 117
......
無料で試せるDP-600日本語試験問題DP-600日本語実際の無料試験問題:https://jp.fast2test.com/DP-600J-premium-file.html