

2025年最新のDY0-001問題集の無料PDFゲットせよ!最近更新された問題
DY0-001認定試験問題集には87練習テスト問題
質問 # 22
A data analyst wants to use compression on an analyzed data set and send it to a new destination for further processing. Which of the following issues will most likely occur?
- A. Library dependency will be missing.
- B. Server CPU usage will be too high.
- C. Operating system support will be missing.
- D. Server memory usage will be too high.
正解:B
解説:
# Compression is a CPU-intensive process because it requires encoding data into a smaller format, often involving complex algorithms. While memory use is usually moderate, CPU usage can spike significantly, especially during real-time compression or large dataset processing.
Why the other options are incorrect:
* A: Library issues are possible but not the most likely issue in compression.
* C: Most operating systems support common compression formats (e.g., .zip, .gz).
* D: Memory usage is generally lower than CPU usage during compression.
Official References:
* CompTIA DataX (DY0-001) Official Study Guide - Section 5.4:"Compression is compute-intensive and may result in increased CPU utilization, particularly on shared servers or during large batch processes."
* Cloud Data Engineering Guide, Chapter 9:"High CPU usage is a common bottleneck in data compression and decompression processes, especially at scale."
-
質問 # 23
Which of the following does k represent in the k-means model?
- A. Number of model tests
- B. Distance between features
- C. Number of data splits
- D. Number of clusters
正解:D
解説:
# In k-means clustering, k represents the number of clusters that the algorithm will attempt to form. The algorithm partitions the dataset into k distinct, non-overlapping clusters based on feature similarity. Each cluster has a centroid, and the algorithm aims to minimize the intra-cluster variance.
Why the other options are incorrect:
* A: Number of tests is unrelated to the k-means algorithm.
* B: Data splits refer to cross-validation or train/test splits, not k in k-means.
* D: Distance between features is computed during clustering but is not what "k" represents.
Official References:
* CompTIA DataX (DY0-001) Official Study Guide - Section 4.2:"In k-means clustering, k denotes the number of clusters into which the dataset will be partitioned."
* Introduction to Machine Learning, Chapter 6:"The 'k' in k-means specifies how many groupings the algorithm will seek to discover based on proximity in feature space."
-
質問 # 24
Which of the following environmental changes is most likely to resolve a memory constraint error when running a complex model using distributed computing?
- A. Adding nodes to a cluster deployment
- B. Migrating to a cloud deployment
- C. Moving model processing to an edge deployment
- D. Converting an on-premises deployment to a containerized deployment
正解:A
解説:
When running a model on a distributed system, encountering memory constraint errors indicates that the current nodes in the cluster do not have enough memory to handle the model. The most scalable and immediate solution is:
# Adding Nodes to a Cluster Deployment - This increases the total available memory and compute power. In distributed computing environments like Apache Spark or Hadoop, horizontal scaling via node addition is a standard remedy for resource bottlenecks, including memory limitations.
Why the other options are incorrect:
* A. Containerizing doesn't inherently solve memory issues unless paired with resource upgrades.
* B. Cloud migration may offer more resources, but without scaling configuration, memory limits may persist.
* C. Edge deployment is for low-latency, local processing - often with less memory, not more.
Official References:
* CompTIA DataX (DY0-001) Official Study Guide - Section 5.2 (Infrastructure & Scaling):"To resolve memory limitations in distributed systems, scaling out by adding nodes is the most direct and cost- effective method."
* Data Engineering Fundamentals (Cloud/Distributed Systems):"Cluster resource constraints (e.g., memory) can be mitigated by increasing node count, enabling parallel execution and expanded memory pools."
-
質問 # 25
Which of the following types of machine learning is a GPU most commonly used for?
- A. Deep learning/neural networks
- B. Clustering
- C. Tree-based
- D. Natural language processing
正解:A
解説:
# GPUs (Graphics Processing Units) are optimized for parallel computations, which are essential for training deep neural networks. These models involve massive matrix operations across multiple layers, making GPUs significantly faster than CPUs in deep learning tasks.
Why the other options are incorrect:
* B: Clustering (e.g., k-means) can benefit from acceleration but doesn't usually require GPU-level computation.
* C: NLP tasks may use GPUs if they involve deep learning (e.g., transformers), but the correct choice is the model type.
* D: Tree-based models (e.g., decision trees, random forests) typically run efficiently on CPUs.
Official References:
* CompTIA DataX (DY0-001) Study Guide - Section 4.3:"Deep learning models, such as neural networks, are computationally intensive and commonly require GPUs for efficient training."
-
質問 # 26
A data scientist is developing a model to predict the outcome of a vote for a national mascot. The choice is between tigers and lions. The full data set represents feedback from individuals representing 17 professions and 12 different locations. The following rank aggregation represents 80% of the data set: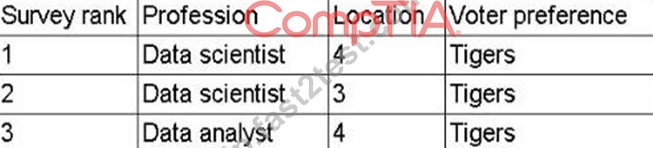
(Screenshot shows survey rankings for just two professions and a few locations, all voting for "Tigers") Which of the following is the most likely concern about the model's ability to predict the outcome of the vote?
- A. Out-of-sample data
- B. Extrapolated data
- C. In-sample data
- D. Interpolated data
正解:B
解説:
# Extrapolated data refers to making predictions about data points that fall outside the observed range or distribution. Since the sample data (80%) is heavily skewed toward a small subset of professions and locations, predicting results for the remaining, unrepresented professions and regions involves extrapolation.
Why the other options are incorrect:
* A: Interpolation occurs within the bounds of observed data - not the issue here.
* C: In-sample data refers to training data, which is overrepresented in this case.
* D: Out-of-sample data is a concern in generalization but extrapolation is more specific here.
Official References:
* CompTIA DataX (DY0-001) Study Guide - Section 3.2:"Extrapolation introduces risk when models are used outside the range of data they were trained on, especially if certain subgroups are underrepresented."
-
質問 # 27
A data scientist is presenting the recommendations from a monthslong modeling and experiment process to the company's Chief Executive Officer. Which of the following is the best set of artifacts to include in the presentation?
- A. Recommendation, charts, justifications, code reviews, and results
- B. Methodology, code snippets, findings, data tables, and p-values
- C. Methods, data overview, results, recommendations, and charts
- D. Results, recommendations, justifications, and clear charts
正解:D
解説:
# For executive-level presentations, the focus should be on strategic outcomes. Therefore, concise results, clear actionable recommendations, visual summaries (charts), and minimal justifications are best. Technical details such as p-values, code, or full methods are too granular.
Why the other options are incorrect:
* A: Too method-heavy for executive audiences.
* C: Includes code reviews - not suitable for a CEO.
* D: Overly technical for high-level stakeholders.
Official References:
* CompTIA DataX (DY0-001) Study Guide - Section 5.5:"Executive communication should focus on outcome-driven recommendations, high-level insights, and actionable visuals."
* Harvard Business Review - Communicating Data to Executives:"Avoid technical detail. Use visuals and clearly stated recommendations supported by business-focused justifications."
質問 # 28
An analyst wants to show how the component pieces of a company's business units contribute to the company's overall revenue. Which of the following should the analyst use to best demonstrate this breakdown?
- A. Residual chart
- B. Scatter plot matrix
- C. Box-and-whisker chart
- D. Sankey diagram
正解:D
解説:
# A Sankey diagram is ideal for illustrating flow-based relationships, such as how different units or sources contribute to a total. It's especially effective for showing proportions, hierarchy, and decomposition - such as revenue contribution by business units.
Why the other options are incorrect:
* A: Box plots show distributions and spread - not contributions or breakdowns.
* C: Scatter plot matrix explores relationships between numeric variables, not part-to-whole relationships.
* D: Residual charts are diagnostic tools for regression - not for revenue visualization.
Official References:
* CompTIA DataX (DY0-001) Official Study Guide - Section 5.5:"Sankey diagrams are useful for visualizing contributions, flows, and proportional allocations across categories."
* Data Visualization Best Practices, Chapter 7:"Sankey charts are preferred when tracking contributions from multiple inputs to a unified output."
質問 # 29
Which of the following distance metrics for KNN is best described as a straight line?
- A. Manhattan
- B. Cosine
- C. Euclidean
- D. Radial
正解:C
解説:
# Euclidean distance is the most intuitive distance metric. It measures the shortest "straight-line" distance between two points in Euclidean space. This is typically used in KNN and clustering when features are continuous and appropriately scaled.
Why the other options are incorrect:
* A: "Radial" isn't a standard distance metric; may refer vaguely to radial basis functions.
* C: Cosine measures the angle (orientation) between vectors - not straight-line distance.
* D: Manhattan distance sums the absolute differences across dimensions - visualized as block-like (taxicab) paths, not direct lines.
Official References:
* CompTIA DataX (DY0-001) Study Guide - Section 4.4:"Euclidean distance is the default metric in KNN for measuring straight-line proximity in feature space."
* Data Mining Techniques, Chapter 3:"Euclidean distance represents the shortest path between two points and is widely used in distance-based learning algorithms."
-
質問 # 30
During EDA, a data scientist wants to look for patterns, such as linearity, in the data. Which of the following plots should the data scientist use?
- A. Q-Q
- B. Scatter
- C. Violin
- D. Box-and-whisker
正解:B
解説:
# Scatter plots are used to examine relationships and trends between two numeric variables. They are especially effective at revealing linear (or nonlinear) patterns, clusters, and outliers.
Why the other options are incorrect:
* A: Violin plots show distribution and density, not relationships.
* B: Box plots compare distributions across groups but don't reveal linearity.
* D: Q-Q plots test normality, not variable relationships.
Official References:
* CompTIA DataX (DY0-001) Official Study Guide - Section 1.2:"Scatter plots are commonly used during EDA to identify correlations, linearity, and outliers between two continuous variables."
* Data Science Fundamentals, Chapter 2 - EDA Techniques:"To assess linear trends and relationships, scatter plots provide a direct visual assessment between variables."
質問 # 31
Which of the following types of layers is used to downsample feature detection when using a convolutional neural network?
- A. Input
- B. Pooling
- C. Output
- D. Hidden
正解:B
解説:
# Pooling layers are used in Convolutional Neural Networks (CNNs) to reduce the spatial dimensions (width and height) of the feature maps. This helps in downsampling, reducing computational complexity, and controlling overfitting by summarizing the features (e.g., max pooling or average pooling).
Why the other options are incorrect:
* B: Input layers receive raw data and do not perform downsampling.
* C: Output layers generate the final prediction.
* D: Hidden layers process data but do not specifically perform downsampling unless designed to do so (e.g., convolutional or pooling sublayers).
Official References:
* CompTIA DataX (DY0-001) Study Guide - Section 4.3:"Pooling layers are used to downsample feature maps and are critical in CNNs for reducing dimensions."
-
質問 # 32
Which of the following is best solved with graph theory?
- A. Traveling salesman
- B. Fraud detection
- C. Optical character recognition
- D. One-armed bandit
正解:A
解説:
# The Traveling Salesman Problem (TSP) is a classic example in graph theory. It involves finding the shortest path that visits a set of nodes (cities) and returns to the starting point. Graph theory is used to model nodes (cities) and edges (paths between cities).
Why other options are incorrect:
* A: OCR is a computer vision problem - best handled with CNNs or ML image models.
* C: Fraud detection can involve graph-based approaches but is typically solved using anomaly detection or classification.
* D: One-armed bandit is a reinforcement learning problem - not related to graph theory.
Official References:
* CompTIA DataX (DY0-001) Study Guide - Section 3.4:"Graph theory is frequently used in routing and path optimization problems such as the Traveling Salesman."
-
質問 # 33
A data scientist is analyzing a data set with categorical features and would like to make those features more useful when building a model. Which of the following data transformation techniques should the data scientist use? (Choose two.)
- A. Pivoting
- B. Label encoding
- C. One-hot encoding
- D. Normalization
- E. Scaling
- F. Linearization
正解:B、C
質問 # 34
A data scientist needs to analyze a company's chemical businesses and is using the master database of the conglomerate company. Nothing in the data differentiates the data observations for the different businesses.
Which of the following is the most efficient way to identify the chemical businesses' observations?
- A. Ingest the data from all of the hard drives and perform exploratory data analysis to identify which business is responsible for chemical operations.
- B. Perform analysis on all of the data and create a summary report on the results relevant to chemical operations.
- C. Consult with the business team to identify which sites are responsible for chemical operations and ingest only the relevant data for analysis.
- D. Ingest data from the hard drive containing the most data and present sample results on the chemicaloperations.
正解:C
解説:
# The most efficient and practical approach is to consult the business stakeholders to understand which sites or data partitions relate to chemical operations. This avoids unnecessary processing of irrelevant data and aligns with the data science best practice of combining domain knowledge with technical methods.
Why the other options are incorrect:
* A: Ingesting all data without guidance is time- and resource-intensive.
* B: Analyzing all data indiscriminately can dilute the focus on chemical business specifics.
* D: Using the largest data set arbitrarily may not reflect chemical operations and lacks targeted relevance.
Official References:
* CompTIA DataX (DY0-001) Official Study Guide - Section 5.1:"Collaboration with domain experts and stakeholders ensures the data scientist focuses on relevant sources and minimizes inefficiency in data preparation."
* CRISP-DM Model - Business Understanding Phase:"Clarifying project objectives with business input is key to aligning data selection with analytical goals."
-
質問 # 35
Which of the following best describes the minimization of the residual term in a ridge linear regression?
- A. 0
- B. e²
- C. e
- D. |e|
正解:B
解説:
# In ridge regression, the model minimizes the sum of squared residuals (errors), with an added penalty term on the magnitude of coefficients (L2 regularization). The residual component specifically is represented by:
# e² (squared error)
Thus, ridge regression minimizes:
Minimize: #(y# # ##)² + ##(#²)
Why the other options are incorrect:
* A: |e| corresponds to L1 loss (used in Lasso).
* B: e represents the error term itself, not its minimized quantity.
* D: Zero error is ideal but practically unachievable and not the actual loss function being minimized.
Official References:
* CompTIA DataX (DY0-001) Study Guide - Section 1.4:"Ridge regression minimizes the squared error term with an L2 penalty."
* Introduction to Statistical Learning, Chapter 6:"Ridge regression uses squared error loss, which emphasizes larger deviations more heavily than linear loss."
-
質問 # 36
A data scientist is analyzing a data set with categorical features and would like to make those features more useful when building a model. Which of the following data transformation techniques should the data scientist use? (Choose two.)
- A. Pivoting
- B. Label encoding
- C. One-hot encoding
- D. Normalization
- E. Scaling
- F. Linearization
正解:B、C
解説:
# Categorical variables must be transformed into numerical form for most machine learning models. Two standard approaches:
* One-hot encoding: Converts each category into a separate binary column (useful for nominal variables).
* Label encoding: Converts categories into integers (useful for ordinal or tree-based models).
Why other options are incorrect:
* A & E: Normalization and scaling are used for continuous variables, not categorical.
* C: Linearization refers to transforming relationships, not categorical conversion.
* F: Pivoting rearranges data structure but doesn't encode categories.
Official References:
* CompTIA DataX (DY0-001) Study Guide - Section 3.3:"Label encoding and one-hot encoding are common transformations applied to categorical variables to enable model compatibility."
-
質問 # 37
Which of the following layer sets includes the minimum three layers required to constitute an artificial neural network?
- A. An input layer, a pooling layer, and an output layer
- B. An input layer, a hidden layer, and an output layer
- C. An input layer, a dropout layer, and a hidden layer
- D. An input layer, a convolutional layer, and a hidden layer
正解:B
解説:
# A basic artificial neural network (ANN) consists of:
* An input layer to receive data
* At least one hidden layer to process the data
* An output layer to produce predictions
These three layers form the minimal architecture required for learning and transformation.
Why the other options are incorrect:
* A: Pooling layers are used in CNNs, not core ANN structure.
* B: Convolutional layers are specific to CNNs.
* D: Dropout is a regularization technique, not a required component.
Official References:
* CompTIA DataX (DY0-001) Study Guide - Section 4.3:"ANNs must include an input layer, hidden layer(s), and an output layer to form a complete learning structure."
* Deep Learning Fundamentals, Chapter 3:"At a minimum, a neural network includes input, hidden, and output layers to process and propagate data."
-
質問 # 38
Which of the following is a key difference between KNN and k-means machine-learning techniques?
- A. KNN is used for classification, while k-means is used for clustering.
- B. KNN operates exclusively on continuous data, while k-means can work with both continuous and categorical data.
- C. KNN performs better with longitudinal data sets, while k-means performs better with survey data sets.
- D. KNN is used for finding centroids, while k-means is used for finding nearest neighbors.
正解:A
解説:
# K-Nearest Neighbors (KNN) is a supervised machine learning algorithm used primarily for classification and regression. It labels a new instance by majority vote (or averaging, in regression) of its k-nearest labeled neighbors.
# k-Means is an unsupervised learning algorithm used for clustering. It partitions unlabeled data into k groups based on feature similarity, using centroids.
Thus, the key difference is in their purpose:
* KNN # Classification (Supervised)
* K-Means # Clustering (Unsupervised)
Why the other options are incorrect:
* A: Both can technically operate on continuous or categorical data (with preprocessing).
* B: This is not a meaningful or standardized distinction.
* C: This reverses the actual roles. k-means finds centroids; KNN finds nearest neighbors.
Official References:
* CompTIA DataX (DY0-001) Official Study Guide - Section 4.1 (Classification vs. Clustering):"KNN is a supervised learning algorithm for classification tasks. K-means is an unsupervised clustering technique that groups data by proximity to centroids."
* Data Science Handbook, Chapter 5:"One key distinction: KNN uses labeled data to classify or regress; k-means uses unlabeled data to identify groupings."
-
質問 # 39
A data scientist wants to predict a person's travel destination. The options are:
* Branson, Missouri, United States
* Mount Kilimanjaro, Tanzania
* Disneyland Paris, Paris, France
* Sydney Opera House, Sydney, Australia
Which of the following models would best fit this use case?
- A. k-means modeling
- B. Linear discriminant analysis
- C. Latent semantic analysis
- D. Principal component analysis
正解:B
解説:
# Linear Discriminant Analysis (LDA) is a supervised classification method used to predict a categorical target (such as travel destination) based on multiple input features. It models decision boundaries between classes - which is appropriate when predicting a fixed set of destinations.
Why the other options are incorrect:
* B: k-means is unsupervised and doesn't use labeled output like travel destination.
* C: Latent Semantic Analysis is used for extracting relationships from textual data - not categorical prediction.
* D: PCA reduces dimensionality but doesn't classify.
Official References:
* CompTIA DataX (DY0-001) Official Study Guide - Section 4.1:"Linear Discriminant Analysis is used when the response variable is categorical and the objective is classification."
* Classification Techniques Guide, Chapter 7:"LDA excels in multi-class prediction when the input data is continuous and the output is a known category."
-
質問 # 40
In a modeling project, people evaluate phrases and provide reactions as the target variable for the model.
Which of the following best describes what this model is doing?
- A. Part-of-speech tagging
- B. Named-entity recognition
- C. Sentiment analysis
- D. TF-IDF vectorization
正解:C
解説:
# Sentiment analysis refers to using machine learning or NLP techniques to determine the sentiment or emotional tone behind a body of text (e.g., positive, neutral, or negative). When people provide reactions to phrases, the model is learning to associate language with subjective emotion or opinion.
Why the other options are incorrect:
* B: NER identifies entities (e.g., locations, organizations) - not emotions.
* C: TF-IDF is a feature engineering method, not a modeling goal.
* D: POS tagging classifies words by their grammatical function - not sentiment.
Official References:
* CompTIA DataX (DY0-001) Official Study Guide - Section 6.3:"Sentiment analysis models associate textual input with subjective labels, such as emotional response or polarity."
* Applied Text Analytics, Chapter 8:"When modeling user reactions to text, sentiment classification techniques are commonly employed."
-
質問 # 41
......
最新DY0-001試験問題集には高得点で一発合格:https://jp.fast2test.com/DY0-001-premium-file.html
CompTIA DY0-001実際の問題とブレーン問題集:https://drive.google.com/open?id=1iYVPfeu_3EFgtv8i-G_d9vRG0-rLgD-n