

最新 [2025年03月] 効果的な学習法でFast2testの問題集で8011テストを合格せよ
実績のある受験者のシミュレーションされた8011試験PDF問題を試そう
質問 # 132
A derivative contract has a negative current replacement value. Which of the following statements is true about its loan equivalent value for credit risk calculations over a 2-year horizon?
- A. Since the derivatives contract has a negative current replacement value, exposure will be zero.
- B. The credit exposure will be a given quintile of the expected distribution of the value of the derivatives contract in the future.
- C. The current exposure can be used for loan equivalence calculations as that is an unbiased proxy for the future value.
- D. The notional value of the derivatives contract should be used for loan equivalence calculations.
正解:B
解説:
The current exposure is negative, so there is no immediate credit exposure. However, since the price of the derivative is volatile, we can reasonably expect the value to be greater than zero sometime in the future. This is a stochastic variable which will have a distribution, and not just a unique value, in the future that will represent the credit exposure. Since there is no unique value, a conservative approach is to pick a quintile of the distribution, and use that as the future value of the derivative contract, with the assurance that the probability of the credit exposure exceeding that quintile is known and has been consciously selected. This number can then be converted to a loan equivalent amount for credit risk purposes. Therefore Choice 'b' is the correct answer. Choice 'a', Choice 'd' and Choice 'c' are incorrect for these reasons.
質問 # 133
When pricing credit risk for an exposure, which of the following is a better measure than the others:
- A. Potential Future Exposure (PFE)
- B. Mark-to-market
- C. Notional amount
- D. Expected Exposure (EE)
正解:D
解説:
Exposure for derivative instruments can vary significantly over the lifetime of the instrument, depending upon how the market moves. The potential future exposure represents the extremes, notthe most likely outcome.
The expected exposure is the most suitable measure for pricing the credit risk. Over time, as multiple transactions are entered into, the expectation (or the mean) will be realized - though individual transactions may have more or less by way of exposure.
The notional amount may not be relevant, though for loans it may be the most important contributor to the expected exposure. Mark-to-market will represent the exposure at a given point in time, but cannot be predicted nor be used to price the credit risk.
質問 # 134
According to the Basel II standard, which of the following conditions must be satisfied before a bank can use
'mark-to-model' for securities in its trading book?
I. Marking-to-market is not possible
II. Market inputs for the model should be sourced in line with market prices III. The model should have been created by the front office IV. The model should be subject to periodic review to determine the accuracy of its performance
- A. I, II, III and IV
- B. II and III
- C. I, II and IV
- D. III and IV
正解:C
解説:
According to Basel II, where marking-to-market is not possible, banks may mark-to-model, where this can be demonstrated to be prudent. Marking-to-model is defined as any valuation which has to be benchmarked, extrapolated or otherwise calculated from a market input. When marking to model, an extra degree of conservatism is appropriate. Supervisory authorities will consider thefollowing in assessing whether a mark- to-model valuation is prudent:
* Senior management should be aware of the elements of the trading book which are subject to mark to model and should understand the materiality of the uncertainty this creates in the reporting of the risk/performance of the business.
* Market inputs should be sourced, to the extent possible, in line with market prices. The appropriateness of the market inputs for the particular position being valued should be reviewed regularly.
* Where available, generally accepted valuation methodologies for particular products should be used as far as possible.
* Where the model is developed by the institution itself, it should be based on appropriate assumptions, which have been assessed and challenged by suitably qualified parties independent of the development process. The model should be developed or approved independently of the front office. It should be independently tested.
This includes validating the mathematics, the assumptions and the software implementation.
* There should be formal change control procedures in place and a secure copy of the model should be held and periodically used to check valuations.
* Risk management should be aware of the weaknesses of the models used and how best to reflect those in the valuation output.
* The model should be subject to periodic review to determine the accuracy of its performance (e.g. assessing continued appropriateness of the assumptions, analysis of P&L versus risk factors, comparison of actual close out values to model outputs).
* Valuation adjustments should be made as appropriate, for example, to cover the uncertainty of the model valuation.
The model should be created independent of the front office, and not by it. Therefore statement III does not represent an appropriate choice. Choice 'a' is the correct answer.
質問 # 135
Which of the following are attributes of a robust stress testing programme at a bank?
- A. Data of appropriate quality and granularity
- B. Robust systems infrastructure
- C. Written policies and procedures
- D. All of the above
正解:D
解説:
A bank's stress testing programme in relation to firm wide stress tests should document the type, frequency and the purpose of the programme, as well as methodologies for defining scenarios and the remedial actions envisaged. Choice 'b' is therefore a necessary attribute of a robust stress testing programme.
The programme should be supported by a robust systems infrastructure that allows the execution of periodic as well as ad-hoc stress tests at the right level (business unit, as well as firm-wide) at the right level of detail or granularity. Choice 'c' also therefore is a valid choice.
A related element is data quality - without which no stress tests can be be credible.
Therefore all the choices listed are correct and Choice 'd' is the correct answer.
質問 # 136
The systemic manifestation of the liquidity crisis during the current credit crisis took many forms. Which of the following is not one of those forms?
- A. Drying up of liquidity in the wholesale money markets
- B. Drying up of liquidity in the cash market for treasury bonds
- C. Stress and large withdrawals from the money markets
- D. Drying up of liquidity in the corporate bond markets
正解:B
解説:
The stresses on liquidity that happened as part of the credit crisis beginning 2007-08 led to drying up of trading and liquidity crisis in the corporate bond markets, the auction rate securities markets, the wholesale (interbank lending) markets, the money markets, the markets for structured products, and even the otherwise liquid futures and forwards markets (as there was no liquidity available to fund the financing of futures). The one market that was not affected was the market for treasuries, in fact the flight to quality ensured that this market was very liquid (even though stressed from a pricing perspective as yields plummetted).
Therefore Choice 'a' is the correct answer.
質問 # 137
Which of the following are considered properties of a 'coherent' risk measure:
I. Monotonicity
II. Homogeneity
III. Translation Invariance
IV. Sub-additivity
- A. II and III
- B. All of the above
- C. II and IV
- D. I and III
正解:C
解説:
All of the properties described are the properties of a 'coherent' risk measure.
Monotonicity means that if a portfolio's future value is expected to be greater than that of another portfolio, its risk should be lower than that of the other portfolio. For example, if the expected return of an asset (or portfolio) is greater than that of another, the first asset must have a lower risk than the other. Another example: between two options if the first has a strike price lower than the second, then the first option will always have a lower risk if all other parameters are the same. VaRsatisfies this property.
Homogeneity is easiest explained by an example: if you double the size of a portfolio, the risk doubles. The linear scaling property of a risk measure is called homogeneity. VaR satisfies this property.
Translation invariance means adding riskless assets to a portfolio reduces total risk. So if cash (which has zero standard deviation and zero correlation with other assets) is added to a portfolio, the risk goes down. A risk measure should satisfy this property, and VaR does.
Sub-additivity means that the total risk for a portfolio should be less than the sum of its parts. This is a property that VaR satisfies most of the time, but not always. As an example, VaR may not be sub-additive for portfolios that have assets with discontinuous payoffs close to the VaR cutoff quantile.
質問 # 138
Which of the following distribution assumptions will produce the lowest probability of exceeding an extreme value, assuming identical means and variances?
- A. a distribution with kurtosis = 5
- B. t-distribution
- C. a normal distribution
- D. a normal mixture distribution
正解:C
解説:
An 'extreme value' will be a value that will lie in the tails. We need to determine the distribution that will have the least weight in the tails so that the probability of exceeding this tail value is minimum across the given choices.
The t-distribution, a distribution with kurtosis > 3 and a normal mixture distribution are all distributions with tails fatter than that for a normal distribution. A normal distribution will have the 'thinnest' tails among the choices and therefore the lowest probability of exceeding a given tail event value.
A note about the t-distribution: Leptokurtic distributions (those that have kurtosis>3, ie kurtosis greater than that for a normal distribution) generally appear to have higher peaks on their PDF graphs. The t-distribution is flatter, and actually appears lower than a normal distribution, which may make one think that it has a lower kurtosis and therefore should have thinner tails than a normal distribution. But that is not so, and the "visual" inspection test fails for inferring the kurtosis from just looking a the shape of the distribution. The kurtosis of a t-distribution is given by the formula {3 + 6/(d - 4)}, where d is the degrees of freedom and d > 4. Therefore the kurtosis of a t-distribution is always greater than 3 as "6/(d-4)" will always be a positive number being added to 3. Therefore there is no conflict between a t-distribution having fatter tails than a normal distribution as it has a higher kurtosis, even though it appears 'lower' on a graph when superimposed with a normal distribution.
質問 # 139
Which of the following cannot be used as an internal credit rating model to assess an individual borrower:
- A. Altman's Z-score
- B. Probit model
- C. Logit model
- D. Distance to default model
正解:D
解説:
Altman's Z-score, the Probit and the Logit models can all be used to assess the credit rating of anindividual borrower.There is no such model as the 'distance to default model', and therefore Choice 'a' is the correct answer.
質問 # 140
Ex-ante VaR estimates may differ from realized P&L due to:
I. the effect of intra day trading
II. timing differences in the accounting systems
III. incorrect estimation of VaR parameters
IV. security returns exhibiting mean reversion
- A. I, II and III
- B. I and III
- C. II, III and IV
- D. I, II and IV
正解:A
解説:
Ex-ante VaR calculations can differ from actual realized P&L due to a large number of reasons. I, II and III represent some of them. Mean reversion however has nothing to do with VaR estimates differing from actual P&L. Therefore Choice 'c' is the correct answer.
質問 # 141
A stock's volatility under EWMA is estimated at 3.5% on a day its price is $10. The next day, the price moves to $11. What is the EWMA estimate of the volatility the next day? Assume the persistence parameter # = 0.93.
- A. 0.0018
- B. 0.0421
- C. 0.0429
- D. 0.0224
正解:B
解説:
The correct answer is choice 'a'
Recall the formula for calculating variance under EWMA. See below. Therefore the correct answer is =SQRT ((1 - 0.93)*(LN(11/10))^2 + 0.93*((3.5%^2))) = 4.21%. Other answers are incorrect. Note that continuous returns are to be used, ie ln(11/10) and not discrete returns (=1/10) - though generally the difference between the two is small over short time periods. (If in the exam the answer doesn't exactly match, try using discrete returns.) A diagram of a mathematical equation Description automatically generated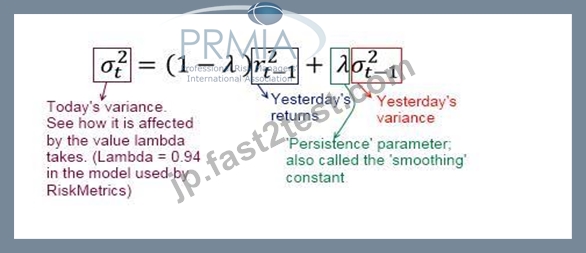
質問 # 142
The loss severity distribution for operational risk loss events is generally modeled by which of the following distributions:
I. the lognormal distribution
II. The gamma density function
III. Generalized hyperbolic distributions
IV. Lognormal mixtures
- A. II and III
- B. I, II and III
- C. I and III
- D. I, II, III and IV
正解:D
解説:
All of the distributions referred to in the question can be used to model the loss severity distribution for op risk. Therefore Choice 'c' is the correct answer.
質問 # 143
Once the frequency and severity distributions for loss events have been determined, which of the following is an accurate description of the process to determine a full loss distribution foroperational risk?
- A. A firm wide operational risk distribution is generated using Monte Carlo simulations
- B. A firm wide operational risk distribution is generated by adding together the frequency and severity distributions
- C. A firm wide operational risk distribution is set to be equal to the product of the frequency and severity distributions
- D. The frequency distribution alone forms the basis for the loss distribution for operational risk
正解:A
解説:
Once the frequency distribution has been determined (for example, using the binomial, Poisson or the negative binomial distributions) and the severity distribution has also been determined (for example, using the lognormal, gamma or other functions), the loss distribution can be produced by a Monte Carlo simulation using successive drawings from each of these two distributions. It is assumed that the severity and frequency are independent of each other. The resulting distribution gives a distribution showing the losses for operational risk, from which there Op Risk VaR can be determined using the appropriate percentile.Therefore Choice 'b' is the correct answer.
質問 # 144
Stress testing is useful for which of the following purposes:
I). For providing the risk manager with an intuitive check on his risk estimates
II). Providing a means of communicating risk implications using plausible scenarios that can be easily explained to a non-technical audience
III). Guarding against major errors in the form of model risk
IV). Complying with the requirements of Basel II.
- A. II and IV
- B. I, II and IV
- C. I, II, III and IV
- D. IV only
正解:C
解説:
Stress testing is used for all the listed purposes. Therefore Choice 'a' is the correct answer.
質問 # 145
Which of the following statements is true in relation to the Supervisory Capital Assessment Program (SCAP):
I. The SCAP is an annual exercise conducted by the Treasury Department to determine the health of key financial institutions in the US economy II. The SCAP was essentially a stress test where the stress scenarios were specified by the regulators III. Capital buffers calculated under the SCAP represented the amount of capital that the institutions covered by SCAP held in excess of Basel II requirements IV. The SCAP focused on both total Tier 1 capital as well as Tier 1 common capital
- A. I and III
- B. II and IV
- C. I and III
- D. I, II and IV
正解:B
解説:
In the February of 2009, the Federal Reserve (which is the US central bank system) and other US banking regulators embarked on a simultaneous assessment of the capital held by the 19 largest US bank holding companies. This was an unprecedented exercise of a kind never undertaken before, and was known as the Supervisory Capital Assessment Program (SCAP). The purpose of the exercise was to determine the amount of additional capital (called the 'capital buffer') each of the institutions covered would need to ensure that it would have sufficient capital if the economy weakened more than was then expected. The idea was that these financial institutions would then raise additional capital equal to their respective capital buffers by the fourth quarter of 2009.
Statement I is false on two counts: firstl the SCAP was conducted by the US central bank and other regulators, and not the 'Treasury Department' (the Treasury Department in the US is the equivalent of the Ministry of Finance in may other countries). Second, the SCAP was a one time exercise, and not annual.
Statement II is correct. The regulators prescribed rates of losses on credit assets of different kinds and other macro-economic assumptions, and asked the banks to determine the extent of losses they would need to bear (in addition to calculating them independently too). Therefore the SCAP was a stress test where the scenario was prescribed by the regulators.
Statement III is false. Capital buffer under the SCAP referred to the additional capital the banks would need to have certain ratios of capital, and not 'excess' capital.
Statement IV is correct. The SCAP envisaged two capital targets: a Tier 1 capital ratio in excess of 6% at the end of 2010; and a Tier 1 common capital ratio in excess of 4%. Therefore both the total Tier 1 capital and Tier 1 common capital were targeted.
Therefore Choice 'c' is the correct answer.
質問 # 146
What is the risk horizon period used for credit risk as generally used for economic capital calculations and as required by regulation?
- A. 10 days
- B. 10 years
- C. 1-day
- D. 1 year
正解:D
解説:
The credit risk horizon for credit VaR is generally one year. Therefore Choice 'b' is the correct answer.
質問 # 147
Random recovery rates in respect of credit risk can be modeled using:
- A. the binomial distribution
- B. the omega distribution
- C. the beta distribution
- D. the normal distribution
正解:C
解説:
The beta distribution is commonly used to model recovery rates. It is a distribution for variables whose values lie between 0 & 1, and the parameters of the distribution can be estimated using the mean and standard deviation of the data. Therefore Choice 'a' is correct and the others are wrong.
Refer to the tutorial on distributions for an Excel model of the beta distribution.
質問 # 148
An asset has a volatility of 10% per year. An investment manager chooses to hedge it with another asset that has a volatility of 9% per year and a correlation of 0.9. Calculate the hedge ratio.
- A. 0.81
- B. 0.9
- C. 1.2345
- D. 0
正解:D
解説:
The minimum variance hedge ratio answers the question of how much of the hedge to buy to hedge a given position. It minimizes the combined volatility of the primary and the hedge position. The minimum variance hedge ratio is given by the expression [ #(x) / #(y) ] * #(x,y)]. Effectively, this is the same as the beta of the primary position with respect to the hedge.
In this case, the hedge ratio is = 10%/9% * 0.9 = 1
質問 # 149
If an institution has $1000 in assets, and $800 in liabilities, what is the economic capital required to avoid insolvency at a 99% level of confidence? The VaR in respect of the assets at 99% confidence over a one year period is $100.
- A. 0
- B. 1
- C. 2
- D. 3
正解:B
解説:
The economic capital required to avoid insolvency is just the asset VaR, ie $100. This means that if the worst case losses are realized, the institution would need to have a buffer equivalent to those losses which in this case will be $100, and this buffer is the economic capital.
The actual value of liabilities is not relevant as they are considered 'riskless' from the institution's point of view, ie they will be taken at full value. In this particular case, the institution has $200 in capital which is more than the economic capital required.
Therefore Choice 'c' is the correct answer.
質問 # 150
The returns for a stock have a monthly volatilty of 5%. Calculate the volatility of the stock over a two month period, assuming returns between months have an autocorrelation of 0.3.
- A. 10%
- B. 8.062%
- C. 7.071%
- D. 5%
正解:B
解説:
The square root of time rule cannot be applied here because the returns across the periods are not independent.
(Recall that the square root of time rule requires returns to be iid, independent and identically distributed.) Here there is a 'autocorrelation' in play, which means one period's returns affect the returns of the other period.
This problem can be solved by combining the variance of the returns from the two consecutive periods in the same way as one would combine the variance of different assets that have a givencorrelation. In such cases we know that:
Variance (A + B) = Variance(A) + Variance(B) + 2*Correlation*StdDev(A)*StdDev(B).
The standard deviation can be calculated by taking the square root of the variance.
Therefore the combined volatility over the two months will be equal to =SQRT((5%^2) + (5%^2) + 2*0.3*5%
*5%) = 8.062%. All other answers are incorrect.
質問 # 151
Which of the following statements is true
I). If no loss data is available, good quality scenarios can be used to model operational risk
II). Scenario data can be mixed with observed loss data for modeling severity and frequency estimates
III). Severity estimates should not be created by fitting models to scenario generated loss data points alone
IV). Scenario assessments should only be used as modifiers to ILD or ELD severity models.
- A. I and II
- B. III and IV
- C. I
- D. All statements are true
正解:A
解説:
There are multiple ways to incorporate scenario analysis for modeling operational risk capital - and the exact approach used depends upon the quantity of loss data available, and the quality of scenario assessments.
Generally:
- If there is no past loss data available, scenarios are the only practical means to model operational risk loss distributions. Both frequency and severity estimates can be modeled based on scenario data.
- If there is plenty of past data available, scenarios can be used as a modifier for estimates that are based solely on data (for example, consider the MAX of the loss estimates at the desired quantile as provided by the data, and as indicated by scenarios)
- If high quality scenario data is available, and there is sufficient past data, one could mix scenario assessments with the loss data and fit the combined data set to create the loss distribution. Alternatively, both could be fitted with severity estimates and then the two severities could be parametrically combined.
In short, there is considerable flexibility in how scenarios can be used.
Statement I is therefore correct, and so is statement II as both indicate valid uses of scenarios.
Statement III is not correct because it may be okay to create severity estimates based on scenario data alone.
Statement IV is not correct because while using scenarios as modifiers to other means of estimation is acceptable, that is not the only use of scenarios.
質問 # 152
Which of the following correctly describes survivorship bias:
- A. Survivorship bias is the tendency for failed companies, markets or investments to be excluded from performance data.
- B. Survivorship bias is the negative skew in returns data resulting from credits that have survived despite a high probability of default
- C. Survivorship bias is the positive tail risk that ensures survival over the long run
- D. Survivorship bias refers to prudent and conservative risk management
正解:A
解説:
Survivorship bias is the tendency for failed companies, funds, investments and even entire markets (eg Russian stock market returns after the Communist revolution) to be excluded from performance studies because they no longer exist. Survivorship bias results in past results looking better than they actually were as data points relating to failures are not included.
A risk manager needs to be aware of survivorship bias when basing risk analysis on historical data and should question if failures (eg failed funds, delisted companies etc) have been included in the data he or she is relying upon.
質問 # 153
......
PRMIA 8011(Credit and Counterparty Manager(CCRM)Certificate)認定試験は、クレジットおよびカウンターパーティリスク管理の知識と理解をテストするために設計されています。この試験は、特に銀行、保険会社、投資会社、規制機関を含む金融業界で働く専門家に適しています。
シミュレーションされた材料で8011テストエンジンで学習:https://jp.fast2test.com/8011-premium-file.html