

厳密検証されたPL-100試験問題集と解答で無料提供のPL-100問題と正解付き
あなたを合格させるPL-100問題集で無料最新Microsoft練習テスト
Microsoft PL-100試験では、Canvasアプリの作成、モデル駆動型アプリの構築、Power Automateを使用してビジネスプロセスを自動化する、Power Virtual Agentを使用したチャットボットの作成、Power BIを使用したデータの分析など、Power Platformに関連するさまざまなトピックをカバーしています。この試験は、データ分析、ビジネスプロセス、およびMicrosoft Officeアプリケーションを基本的に理解している個人を対象としており、試験を試みる前に候補者がMicrosoft Power Platformを使用した経験を持つことをお勧めします。 Microsoft PL-100認定試験に合格すると、個人がビジネス価値を促進し、組織がビジネスプロセスを最適化するのに役立つソリューションの作成に熟練していることが示されています。
質問 # 80
The customer service team of a company uses a model-driven app to log customer interactions. The app contains two tables: one to track customer interactions and one to track products.
The team requires an interactive dashboard to display the activities. The dashboard must display the products that have the most complaints. Each chart must display the associated data.
You need to create the dashboard-
Which features should you use? To answer, select the appropriate options in the answer area.
NOTE: Each correct selection is worth one point.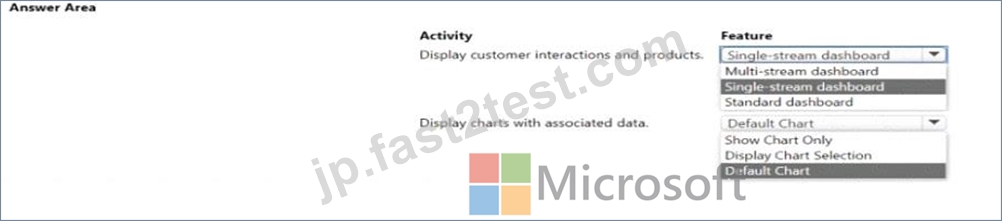
正解:
解説:
Explanation
質問 # 81
You are developing a Power BI report for a company.
The Power BI report must display company performance metrics in Power BI service. The report must include three fields in a visualization. The data for the report exists in a dataset.
The company will display the report on a large television screen during team meetings.
You need to create the report.
Which four actions should you perform in sequence? To answer, move the appropriate actions from the list of actions to the answer and arrange them in the correct order.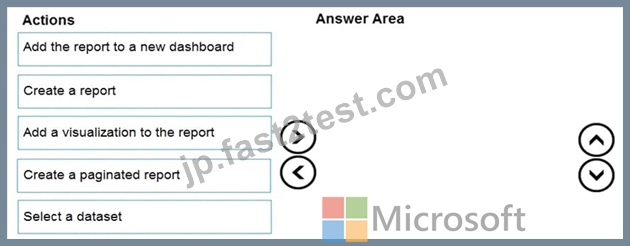
正解:
解説: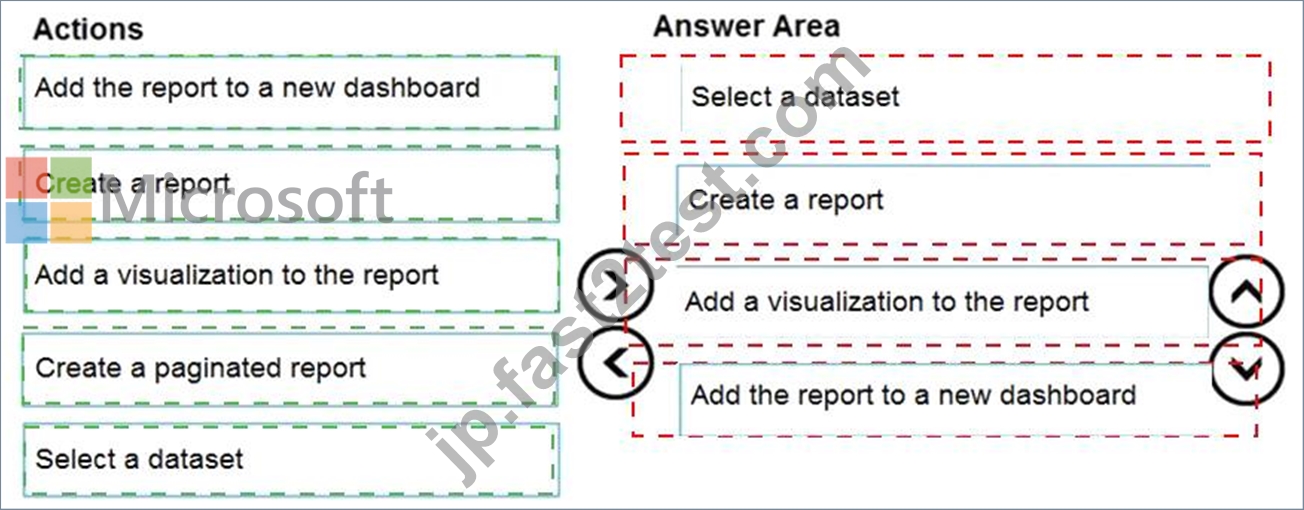
Explanation
Graphical user interface, text, application, chat or text message Description automatically generated
Box 1: Select a dataset
Sign in to your Power BI online account, or sign up, if you don't have an account yet.
Open the Power BI service.
Get some data and open it in report view.
Box 2: Create a report
Use that data to create visualizations and save it as a report.
Box 3: Add a visualization to the report
Box 4: Add the report to a new dashboard
Visualizations (known as visuals for short) display insights that have been discovered in the data. A Power BI report might have a single page with one visual or it might have pages full of visuals. In the Power BI service, visuals can be pinned from reports to dashboards.
Reference:
https://docs.microsoft.com/en-us/power-bi/fundamentals/service-get-started
https://docs.microsoft.com/en-us/power-bi/visuals/power-bi-report-visualizations
質問 # 82
A company uses Power Automate. You manage two cloud flows named A and B. Users must perform the following activities:
* Manage the properties of cloud flow A.
* Manually trigger cloud flow B
You need to set up privileges for the business users by using the principle of least privilege Which privilege types should you grant for each activity? To answer, drag the appropriate privilege types to the correct activities. Each privilege type may be used once, more than once, or not at all. You may need to drag the split bar between panes or scroll to view content.
Note: Each correct selection is worth one point.
正解:
解説:
Explanation
質問 # 83
Note: This question is part of a series of questions that present the same scenario. Each question in the series contains a unique solution that might meet the stated goals. Some question sets might have more than one correct solution, while others might not have a correct solution.
After you answer a question in this section, you will NOT be able to return to it. As a result, these questions will not appear in the review screen.
A company has locations in multiple countries and regions across four continents.
The company stores the total amount of each order in the local currency of the country/region where the customer is located. The company stores the applicable exchange rates in a custom US dollars (USD) exchange rate table.
You need to create a visualization that displays the total amount of orders by country/region in USD.
Proposed solution:
Create a custom column that converts the order total to USD by using the relationship between order local currency and the USD exchange rate table in Power BI Desktop and display this column in a Power BI chart by country/region.
Does the solution meet the goal?
- A. No
- B. Yes
正解:A
解説:
Explanation
Instead use a calculated field.
Need to calculate the exchange rate in USD.
Calculated columns are calculated in real-time when they are retrieved.
Reference:
https://docs.microsoft.com/en-us/powerapps/developer/data-platform/calculated-rollup-attributes
質問 # 84
You create a canvas app for a service company.
Using the Tree view, you navigate to the ViewServices screen. The screen contains a form named DetailForm1 that only contains Label controls. You add the People icon to the header of the ViewServices screen as shown below:
When you select the icon a new Activity form opens. You must set the value of the Name field on the new Activity form to the value of the name field from DetailForm1.
Use the drop-down menus to select the answer choice that answers each question based on the information presented in the graphic.
NOTE: Each correct selection is worth one point.
正解:
解説:
Reference:
https://docs.microsoft.com/en-us/powerapps/maker/canvas-apps/functions/function-select
質問 # 85
A company must use a Power Apps app custom control that is exported from a different canvas Power Apps app.
You need to insert the custom control into the Power Apps app.
Where should you complete the actions? To answer, drag the appropriate locations to the correct actions. Each location may be used once, more than once, or not at all. You may need to drag the split bar between panes or scroll to view content.
NOTE: Each correct selection is worth one point.
正解:
解説:
Reference:
https://docs.microsoft.com/en-us/powerapps/developer/component-framework/component-framework-for-canvas-apps
質問 # 86
HOTSPOT
You need to configure the system to meet the requirements.
What should you use? To answer, select the appropriate options in the answer area.
NOTE: Each correct selection is worth one point.
Hot Area: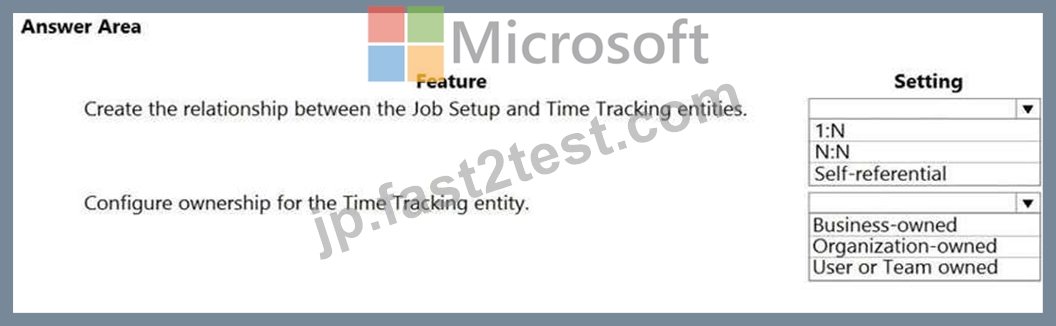
正解:
解説: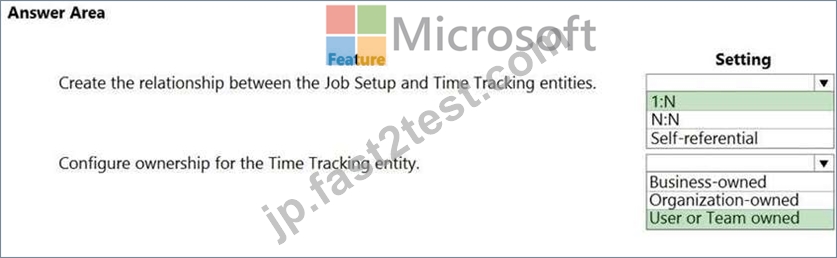
Explanation:
Box 1: 1:N
Scenario: A sortable listing of all in-process jobs from the Job Setup table, by customer, start date, and product.
Box 2: User or Team owned
Scenario: Employees must only be able to access their own time tracking records from the app.
User or team: Data belongs to a user or a team. Actions that can be performed on these records can be controlled on a user level.
Reference:
https://docs.microsoft.com/en-us/powerapps/maker/common-data-service/types-of-entities
質問 # 87
A company uses a model-driven app. You create a Power BI sales report.
The executive of the company wants all users to see tiles from the report in the model-driven app.
You need to ensure all users can see the tiles.
What should you do? To answer, select the appropriate options in the answer area.
NOTE:Each correct selection is worth one point.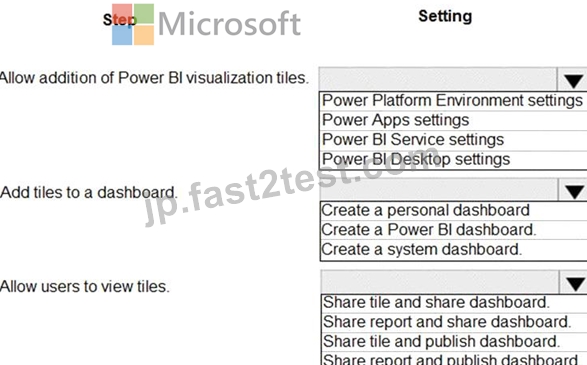
正解:
解説: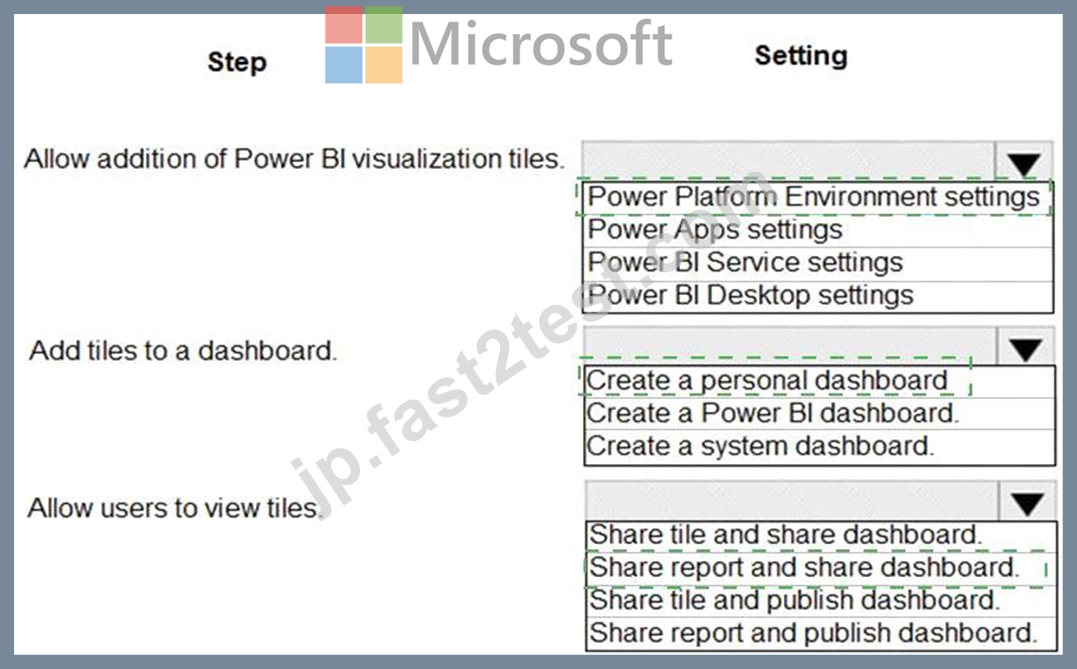
Explanation
Graphical user interface, text Description automatically generated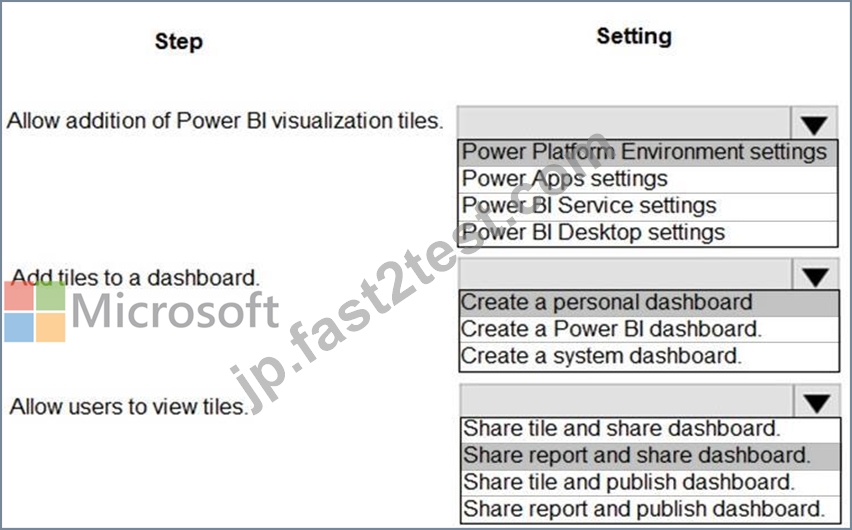
Box 1: Power Platform Environment settings
Before users can embed Power BI visualizations on personal dashboards, the organization-wide setting must be enabled.
In the Power Platform admin center, select an environment.
Select Settings > Product > Features.
Under Embedded content set Power BI visualization embedding to On to enable or Off to disable.
Select Save.
Box 2: Create a personal dashboard
You can embed Power BI tiles on your personal dashboard.
Open your app and go to Dashboards.
Select an existing personal dashboard or select New to create one.
On the dashboard, select an area where you want the tile to appear, and then select Power BI Tile on the toolbar.
Add new Power BI tile.
In the Power BI Tile dialog, select the workspace and then select the Power BI tile that you want to display on your dashboard. Select Enable for mobile if you want to make the tile available for Dynamics
365 for tablets and Dynamics 365 for phones.
Select another area of the dashboard and repeat this step to add another Power BI tile, or other component, such as a chart or list, to your dashboard.
Select Save to save your dashboard.
Box 3: Share report and share dashboard.
To share your personal dashboard that contains Power BI visualizations you must configure sharing in both Dataverse and Power BI, and the user or group must have the same credentials and appropriate level of access in both services. To share your personal dashboard in your app, go to Dashboards. In the list of dashboards, select the personal dashboard you want, and then select SHARE DASHBOARD.
Reference:
https://docs.microsoft.com/en-us/power-platform/admin/use-power-bi#embed--visualizations-on-personal-dashb
質問 # 88
You are creating a capacity planning dashboard with Power BI desktop.
The dashboard must be able to be used within a model-driven manufacturing planning app as well as be embedded within a Microsoft Teams channel.
The data sources are as follows: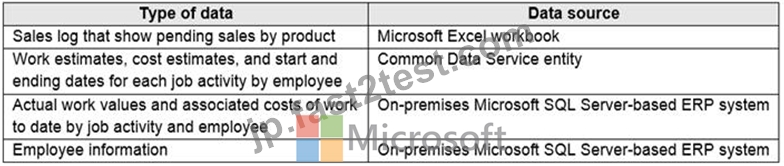
You need to determine the appropriate method for accomplishing each task.
Which methods should you use? To answer, select the appropriate options in the answer area.
NOTE: Each correct selection is worth one point.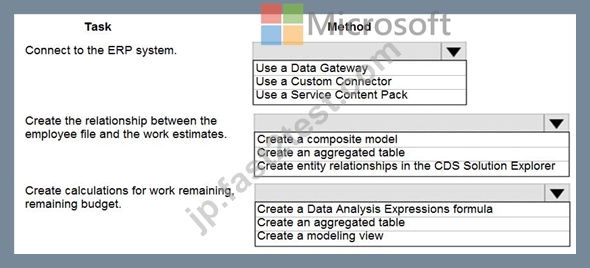
正解:
解説: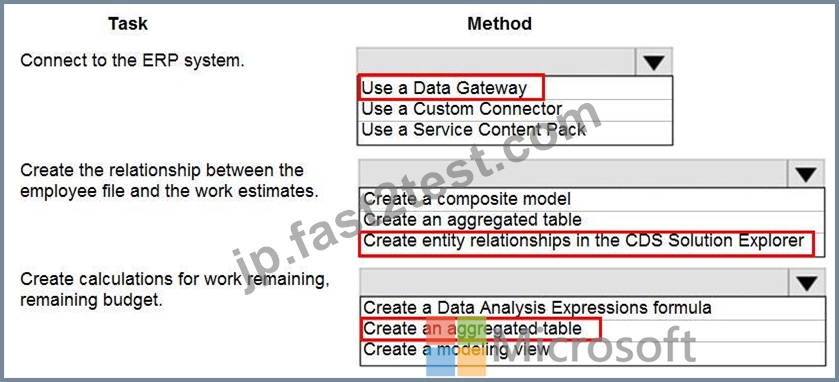
Reference:
https://docs.microsoft.com/en-us/power-bi/connect-data/service-gateway-sql-tutorial
https://docs.microsoft.com/en-us/powerapps/maker/data-platform/create-edit-entity-relationships
https://docs.microsoft.com/en-us/powerapps/maker/data-platform/define-rollup-fields
質問 # 89
You are configuring a new Common Data Service environment by using the Power Apps Maker portal.
You need to create an entity that uses the prefix xyz.
Which four actions should you perform in sequence? To answer, move the appropriate actions from the list of actions to the answer area and arrange them in the correct order.
正解:
解説:
Reference:
https://docs.microsoft.com/en-us/powerapps/maker/common-data-service/data-platform-create-entity
質問 # 90
You need to meet the requirement for the time tracking app.
Which controls should you use? To answer, select the appropriate options in the answer area.
NOTE: Each correct selection is worth one point.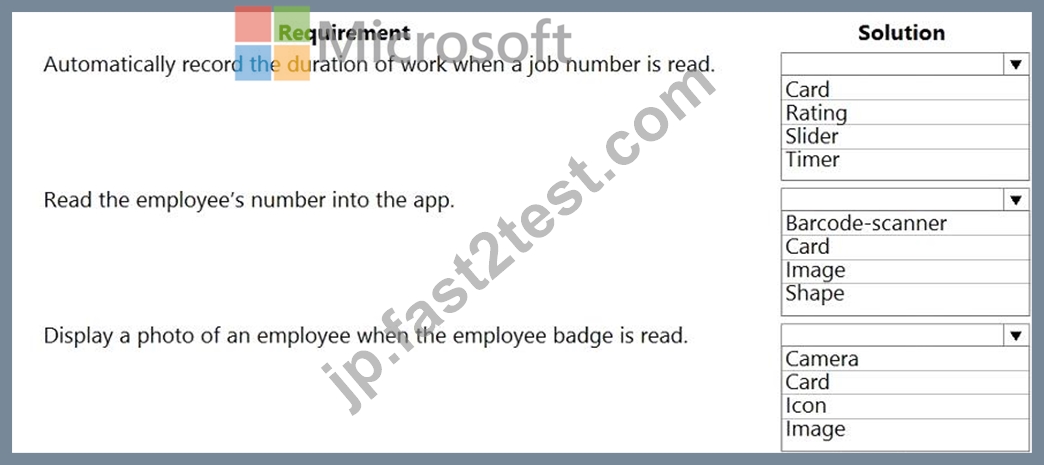
正解:
解説: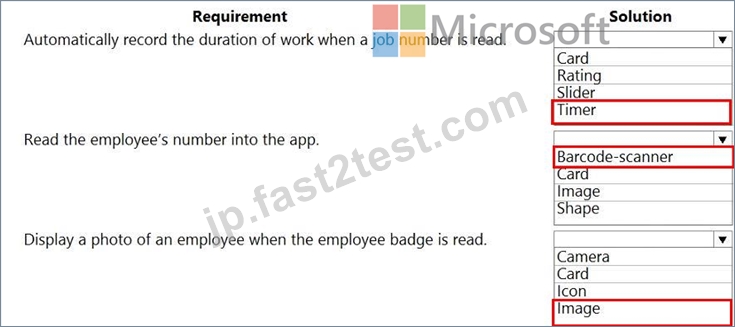
Reference:
https://docs.microsoft.com/en-us/powerapps/maker/canvas-apps/controls/control-new-barcode-scanner
https://docs.microsoft.com/en-us/powerapps/maker/canvas-apps/controls/control-image
質問 # 91
You create a canvas app within a Power Platform environment.
You need to identify potential accessibility issues for the canvas app before making the app available to other users.
Which tool should you use?
- A. Portal Checker
- B. App Checker
- C. Solution Checker
正解:B
質問 # 92
Note: This question is part of a series of questions that present the same scenario. Each question in the series contains a unique solution that might meet the stated goals. Some question sets might have more than one correct solution, while others might not have a correct solution.
After you answer a question in this section, you will NOT be able to return to it. As a result, these questions will not appear in the review screen.
You build a canvas app for a manufacturing company. The company receives parts and materials from many vendors. You create a form to collect information from packing slips.
Receivers must be able to take a picture of packing slips to receive materials instead of manually entering data in the app.
You need to ensure that users can scan packing slip information into the form.
Proposed solution: Use a Category classification model.
Does the solution meet the goal?
- A. No
- B. Yes
正解:A
解説:
Explanation
A Category classification model categorizes text by its meaning.
Reference:
https://knowledgefrommanish.com/powerplatform/ai-builder-entity-extraction-ai-model/
質問 # 93
A company is building a canvas app.
A user needs to understand which data they can make available for the 500 contacts that are present in the Contact table. All relevant data must be shown in the app. Single fields must show one record and grids must show multiple records. Only the primary fields for each related table should be shown for a contact.
Use the drop-down menus to select the answer choice that answers each question based on the information presented in the graphic.
NOTE: Each correct selection is worth one point.
正解:
解説: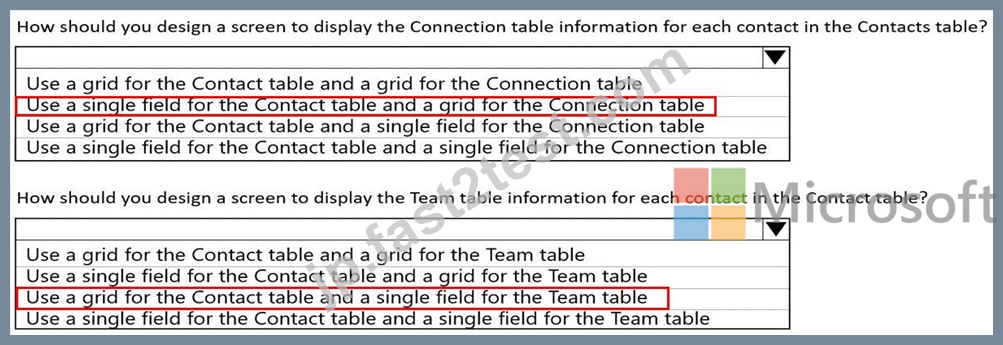
質問 # 94
You store data about products in two Microsoft Excel worksheets.
The data contains duplicate rows.
You need to consolidate data from the two worksheets into a Microsoft Dataverse custom table.
In which order should you perform the actions? To answer, move all actions from the list of actions to the answer area and arrange them in the correct order.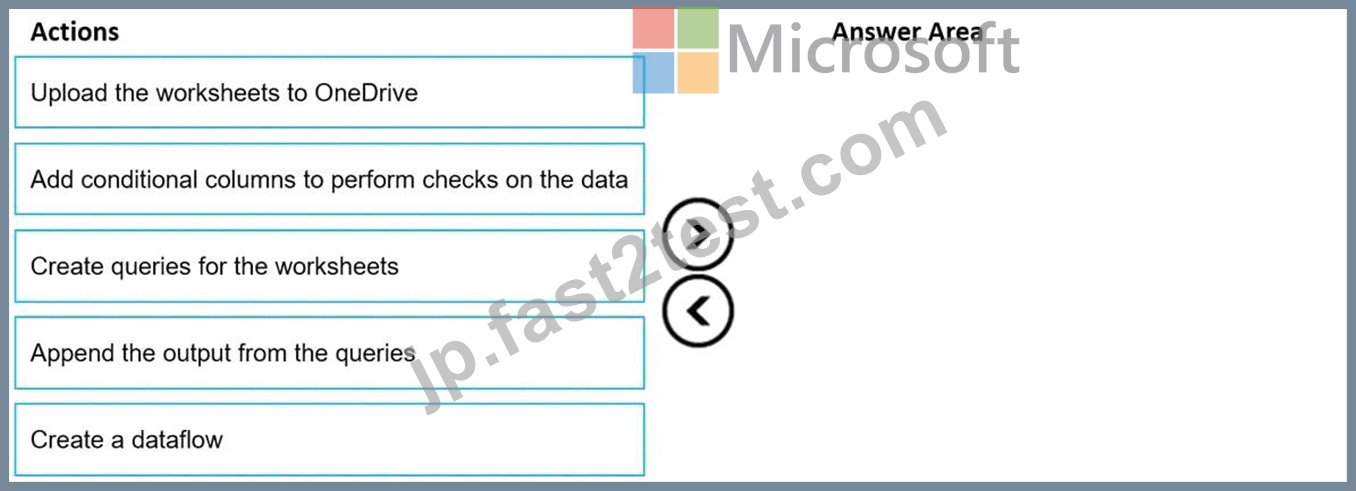
正解:
解説:
Explanation
Graphical user interface, text, application, email Description automatically generated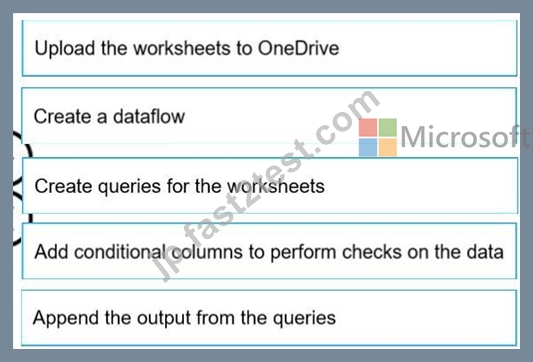
Step 1: Upload the worksheets to OneDrive
A data source needs to be specified. The data needs to be available.
Step 2: Create a dataflow
Step 3: Create queries for the worksheets
You can shape your data selection into a form that works best for your table using a Power Query editing experience, similar to the Power Query Editor in Power BI Desktop.
Step 4: Add conditional columns to perform checks on the data
Step 5: Append the output of the queries
Reference:
https://docs.microsoft.com/en-us/powerapps/maker/data-platform/create-and-use-dataflows
https://docs.microsoft.com/en-us/power-query/dataflows/add-data-power-query
質問 # 95
A company uses Power Apps and Microsoft Dataverse.
The company has model driven apps across multiple Microsoft Dataverse environments in the same tenant. You must grant privileges to Power Apps makers to achieve the following:
* Share model-driven apps in multiple Microsoft Dataverse environments.
* Share model-driven apps in only one of the Microsoft Dataverse environments and view only table records that they create themselves.
You need to share the model-driven app with users by using the principle of least privilege.
Which security role privilege should you grant for each requirement? To answer, drag the appropriate security roles to the correct requirements. Each security the may be used once, more than once, or not at all. You may need to drag the split bar between panes or scroll to view content.
NOTE: Each correct answer is worth one point.
正解:
解説:
質問 # 96
A company is creating Power Apps apps for their customer service team.
You must create a final released solution to export to their test environment that cannot be changed in the new environment.
You need to determine the types of solutions to use.
Which type of solution should you use? To answer, drag the appropriate solution types to the correct conditions. Each solution type may be used once, more than once, or not at all. You may need to drag the split bar between panes or scroll to view content.
NOTE: Each correct selection is worth one point.
正解:
解説: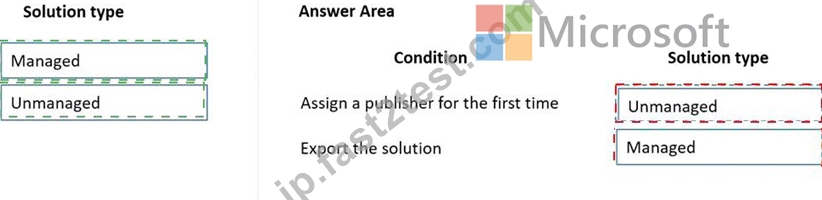
Explanation
Graphical user interface, application Description automatically generated
Box 1: Unmanaged
Unmanaged solutions are used in development environments while you make changes to your application.
Box 2: Managed
Managed solutions are used to deploy to any environment that isn't a development environment for that solution.
Reference:
https://docs.microsoft.com/en-us/power-platform/alm/solution-concepts-alm
質問 # 97
You need to configure the system to meet the requirements.
What should you use? To answer, select the appropriate options in the answer area.
NOTE: Each correct selection is worth one point.
正解:
解説:
Reference:
https://docs.microsoft.com/en-us/powerapps/maker/common-data-service/types-of-entities
質問 # 98
You need to ensure that the app can support the needs of User2 and User3, and meets the production deployment requirements.
Which tools should you use? To answer, select the appropriate tool in the answer area.
NOTE: Each correct selection is worth one point.
正解:
解説:
Reference:
https://docs.microsoft.com/en-us/powerapps/maker/canvas-apps/accessibility-checker
https://docs.microsoft.com/en-us/powerapps/maker/common-data-service/use-powerapps-checker
質問 # 99
You are creating an app for an organization's human resources (HR) department. You create an Employee entity in an unmanaged Common Data Service solution.
Another user creates the following Power Automate flows separately from the solution: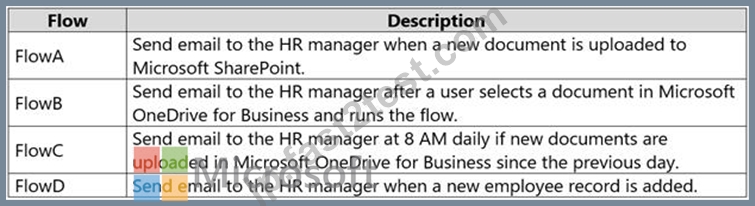
You need to incorporate the flows that can be added to the solution.
Which two flows can you include? Each correct selection presents a complete solution.
NOTE:Each correct selection is worth one point.
- A. FlowC
- B. FlowB
- C. FlowA
- D. FlowD
正解:C、D
解説:
Explanation
You can add any of these conditions to determine precisely when your flow is triggered.
Reference:
https://docs.microsoft.com/en-us/power-automate/connection-cds-native
質問 # 100
A company uses Power Automate and Power Apps to streamline business processes.
You need to use AI Builder to analyze customer reviews of the company's products.
In which order should you perform the actions? To answer, move all actions from the list of actions to the answer area and arrange them in the correct order.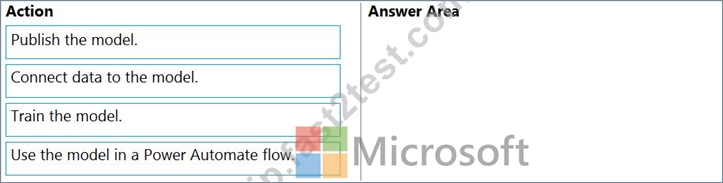
正解:
解説:
Reference:
https://powerapps.microsoft.com/en-us/blog/introducing-simplified-ai-builder-experience-in-power-automate/
質問 # 101
A company has the following divisions: wholesale and retail.
The manufacturer wants to create a single Power BI report to allow users to view data from a Microsoft SQL Server database.
You need to ensure that each user sees data only for the team to which the user is assigned.
How should you secure the report?
To answer, drag the appropriate options to the correct action. Each option may be used once, more than once, or not at all. You may need to drag the split bar between panes or scroll to view content.
NOTE: Each correct selection is worth one point.
正解:
解説: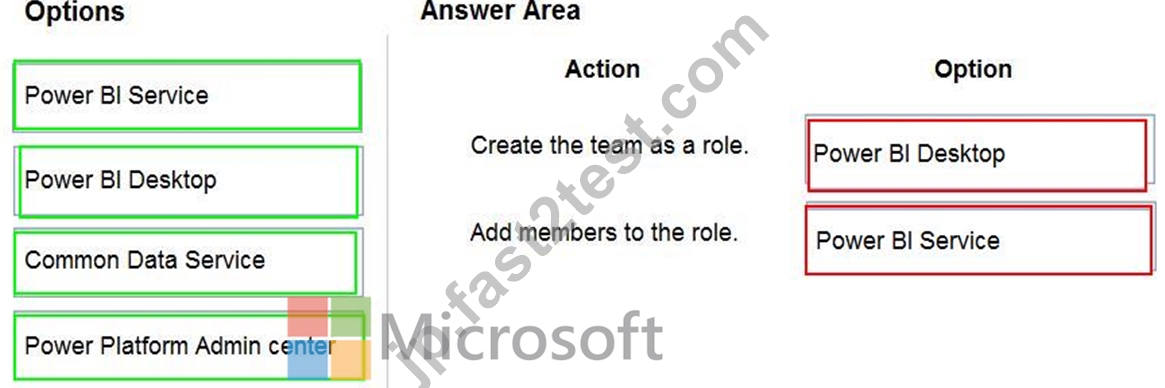
Reference:
https://docs.microsoft.com/en-us/power-bi/create-reports/desktop-rls
質問 # 102
You need to configure the app to meet the requirements.
Which object properties should you configure? To answer, select the appropriate options in the answer area.
NOTE: Each correct selection is worth one point.
正解:
解説:
Reference:
https://docs.microsoft.com/en-us/powerapps/maker/canvas-apps/controls/control-screen
https://docs.microsoft.com/en-us/powerapps/maker/canvas-apps/functions/function-form
質問 # 103
A company uses a model-driven app. You create a Power BI sales report.
The executive of the company wants all users to see tiles from the report in the model-driven app.
You need to ensure all users can see the tiles.
What should you do? To answer, select the appropriate options in the answer area.
NOTE: Each correct selection is worth one point.
正解:
解説: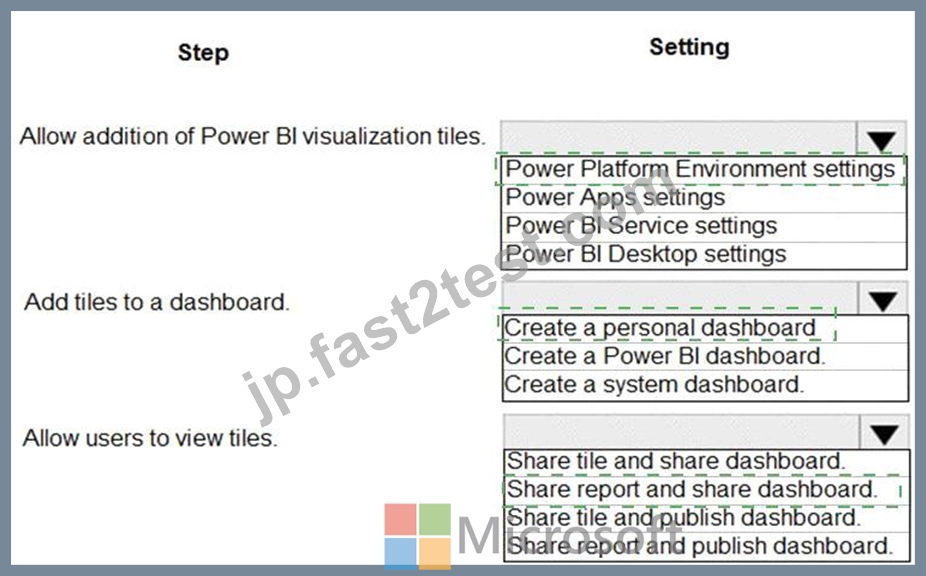
Explanation
Graphical user interface, text Description automatically generated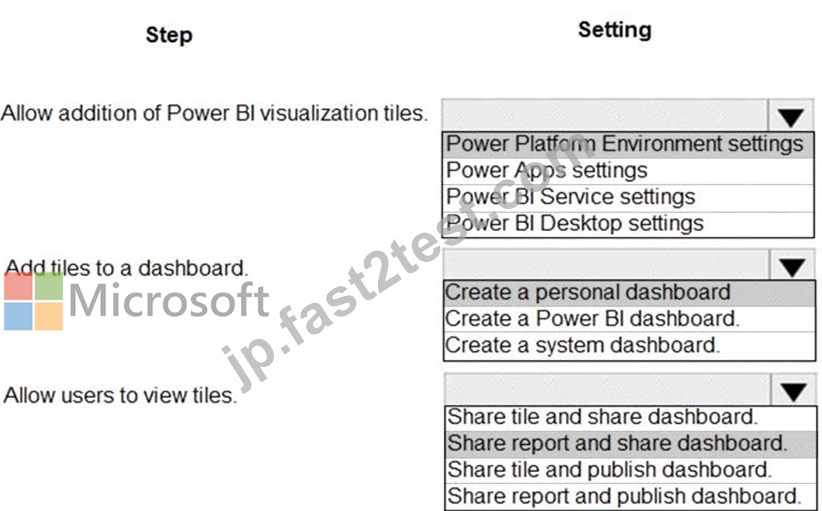
Box 1: Power Platform Environment settings
Before users can embed Power BI visualizations on personal dashboards, the organization-wide setting must be enabled.
* In the Power Platform admin center, select an environment.
* Select Settings > Product > Features.
* Under Embedded content set Power BI visualization embedding to On to enable or Off to disable.
* Select Save.
Box 2: Create a personal dashboard
You can embed Power BI tiles on your personal dashboard.
* Open your app and go to Dashboards.
* Select an existing personal dashboard or select New to create one.
* On the dashboard, select an area where you want the tile to appear, and then select Power BI Tile on the toolbar.
* Add new Power BI tile.
* In the Power BI Tile dialog, select the workspace and then select the Power BI tile that you want to display on your dashboard. Select Enable for mobile if you want to make the tile available for Dynamics
365 for tablets and Dynamics 365 for phones.
* Select another area of the dashboard and repeat this step to add another Power BI tile, or other component, such as a chart or list, to your dashboard.
* Select Save to save your dashboard.
Box 3: Share report and share dashboard.
To share your personal dashboard that contains Power BI visualizations you must configure sharing in both Dataverse and Power BI, and the user or group must have the same credentials and appropriate level of access in both services. To share your personal dashboard in your app, go to Dashboards. In the list of dashboards, select the personal dashboard you want, and then select SHARE DASHBOARD.
Reference:
https://docs.microsoft.com/en-us/power-platform/admin/use-power-bi#embed--visualizations-on-personal-dashb
質問 # 104
You are Designing a Power Virtual Agents chatbot in Microsoft Teams. You create an outline to describe how a conversation should be structured.
You need to configure the chatbot.
Which chatbot component should you use? To answer, drag the appropriate components to the correct conversation elements. Each component may be used once, more than once, or not at all. You may need to drag the spirt bar between panes or scroll to view content.
NOTE: Each correct selection is worth one point.
正解:
解説:
質問 # 105
......
Microsoft PL-100(Microsoft Power Platform App Maker)試験は、Microsoft Power Platformを使用してカスタムビジネスアプリケーションの作成に関心のある個人のスキルと知識をテストするように設計されています。この試験では、候補者が組織のビジネスニーズを満たすソリューションを設計、開発、実装する能力を測定します。この試験に合格すると、個人がパワーアプリ、パワーオートメート、パワーBIを含むパワープラットフォームで作業するために必要なスキルを持っていることを検証します。
Microsoft PL-100試験は、Microsoftパワープラットフォームを使用してカスタムアプリケーションを作成する知識とスキルを証明するために設計された認定試験です。試験は、プラットフォームに関連するさまざまなトピックをカバーし、テストセンターで対面受験またはオンラインで受験することができます。試験に合格することは、パワープラットフォームを使用してカスタムアプリケーションを作成するために必要なスキルや知識を持っていることを示し、この分野でキャリアを進めたい個人にとって貴重な認定となります。
無料でゲット!高評価Microsoft PL-100試験問題集今すぐダウンロード!:https://jp.fast2test.com/PL-100-premium-file.html
PL-100試験問題集合格には最新なテスト問題集:https://drive.google.com/open?id=1fHHY0Ky5F15LbN9hLr9kj46hMtdjDSUg